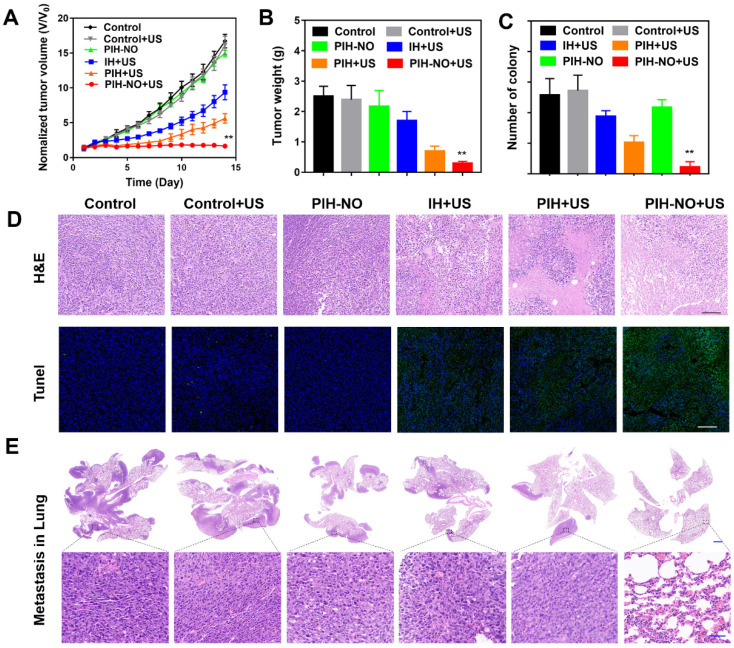
Figure 7.
Inhibition of tumor and metastasis of PIH-NO in vivo. (A) Tumor growth curves and (B) average tumor weight after various treatments. (C) The number of lung metastasis. (D) H&E and TUNEL staining of tumor slices after various treatments on the 14th day. The scale bar is 200 μm. (E) H&E staining of lung metastatic nodules. The scale bar is 100 μm. *p <0.05, **p <0.01 (PIH-NO with US vs. other treatments). Data are expressed as means ± SD (n = 6).

