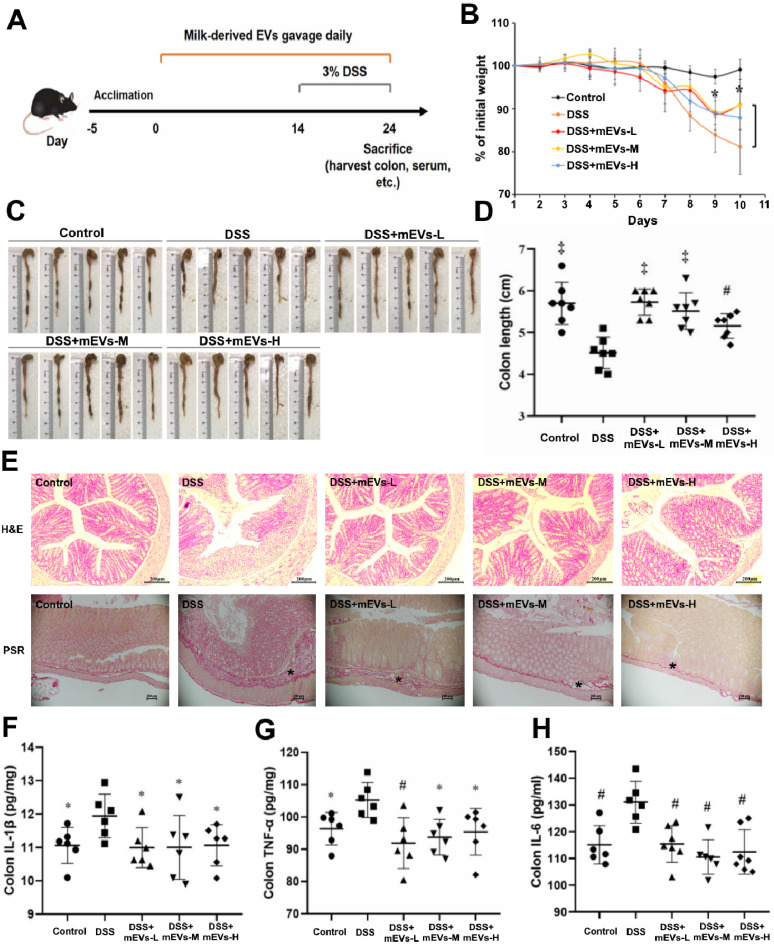
Figure 3.
mEVs alleviate DSS-induced ulcerative colitis (UC). (A) A schematic diagram illustrating administration schedule of mEVs in a DSS-induced mouse model of UC. (B) Change of body weight among different treatment groups. *p < 0.05 vs. the DSS group. (C, D) Colon length comparison. (E) Representative colon sections stained with hematoxylin and eosin (H&E, Scale bars represent 200 μm) and picrosirius red (PSR, Scale bars represent 100 μm). Asterisks indicate fibrosis within the intestinal submucosal layer. (F-H) Protein levels of colonic IL-1β, IL-6, and TNF-α determined by ELISA. Data were presented as mean ± SD (n = 7). *p < 0.05, #p < 0.01 and ‡p < 0.001 vs. DSS group (UC).

