
Figure 5.
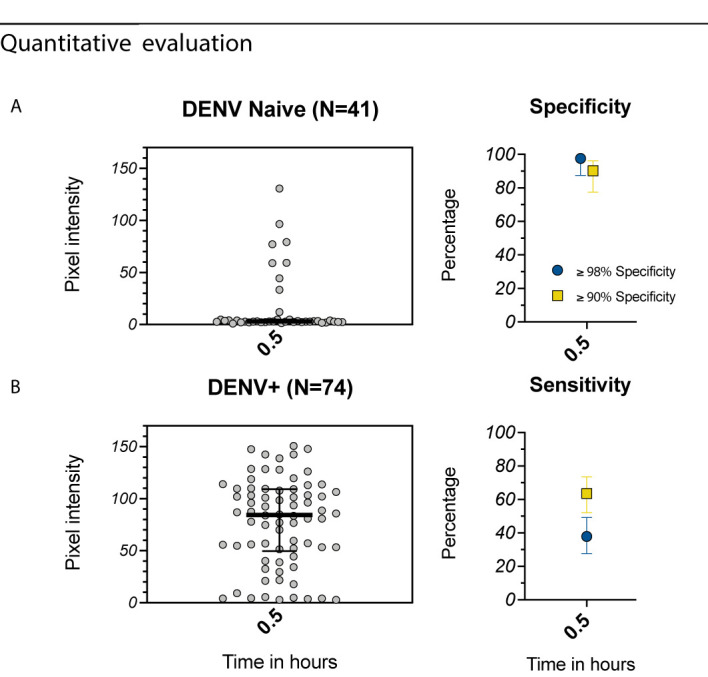
Evaluation of the Excivion Dengue IgG RDT using samples from the ECUAVIDA Study. (A, B) Quantitative evaluation of RDT tests using the ChemBio Cube lateral flow reader, measured as IgG band pixel intensity (medians and interquartile ranges are shown as summary statistics). Data are plotted separately for (A) DENV-seronegative and (B) DENV-seropositive samples as classified by Dengue Abcam ELISA. Specificity and sensitivity values (dots) with 95% confidence intervals (vertical bars) are shown at a single timepoint, with specificity set to either ≥98% or ≥90%. Corresponding sensitivity values are shown.