
Figure 6.
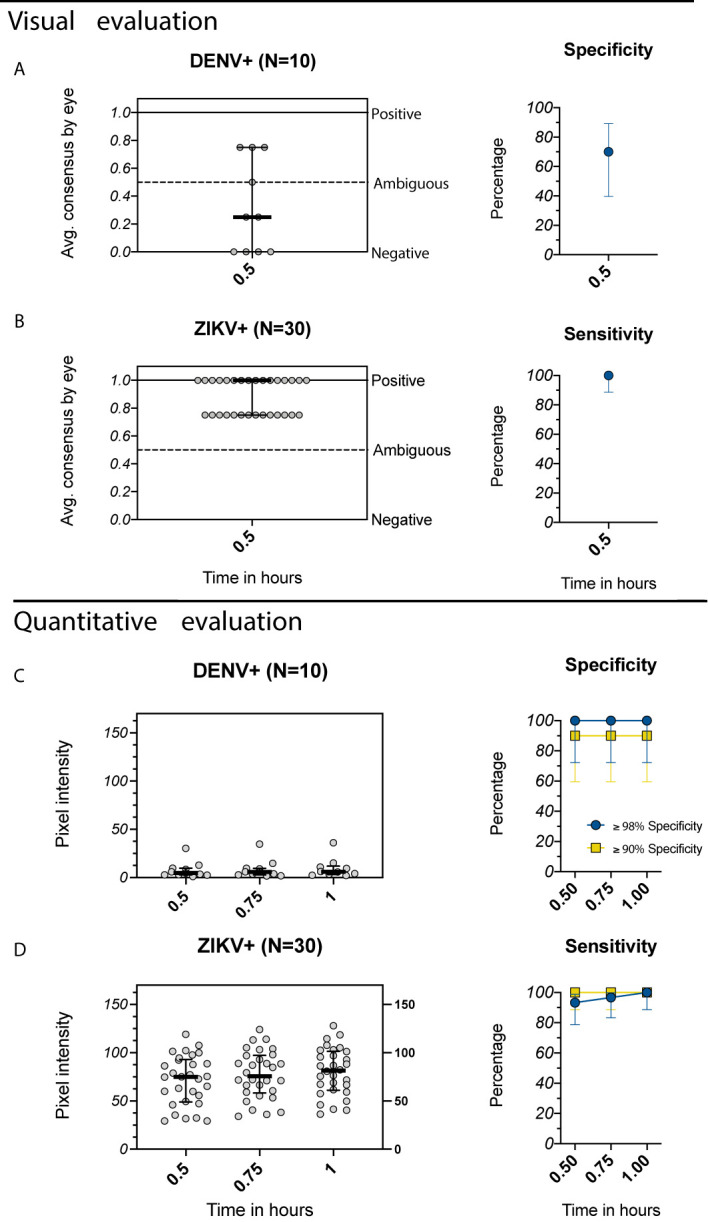
Evaluation of the Excivion Zika IgG RDT using samples from the Nicaragua Pediatric Dengue Cohort and Hospital-based Studies. (A, B) Average visual readings for IgG band positivity evaluated in one experiment by two separate analysts (individual dots) at single timepoint (medians and interquartile ranges are shown). Analyses are grouped by (A) DENV+ samples (primary DENV infection with one of the four serotypes or multiple prior DENV infections) and (B) ZIKV+ samples (prior ZIKV infection but not DENV infection). Corresponding specificity and sensitivity values (dots) with 95% confidence intervals (vertical bars) are shown. (C, D) Equivalent to A and B, but with quantitative evaluation of RDT tests using the ChemBio Cube lateral flow reader, measured as IgG band pixel intensity at multiple timepoints. Optimal (≥98%) and minimum (≥90%) specificity and corresponding sensitivity values are shown. Simple linear regressions show temporal trends.