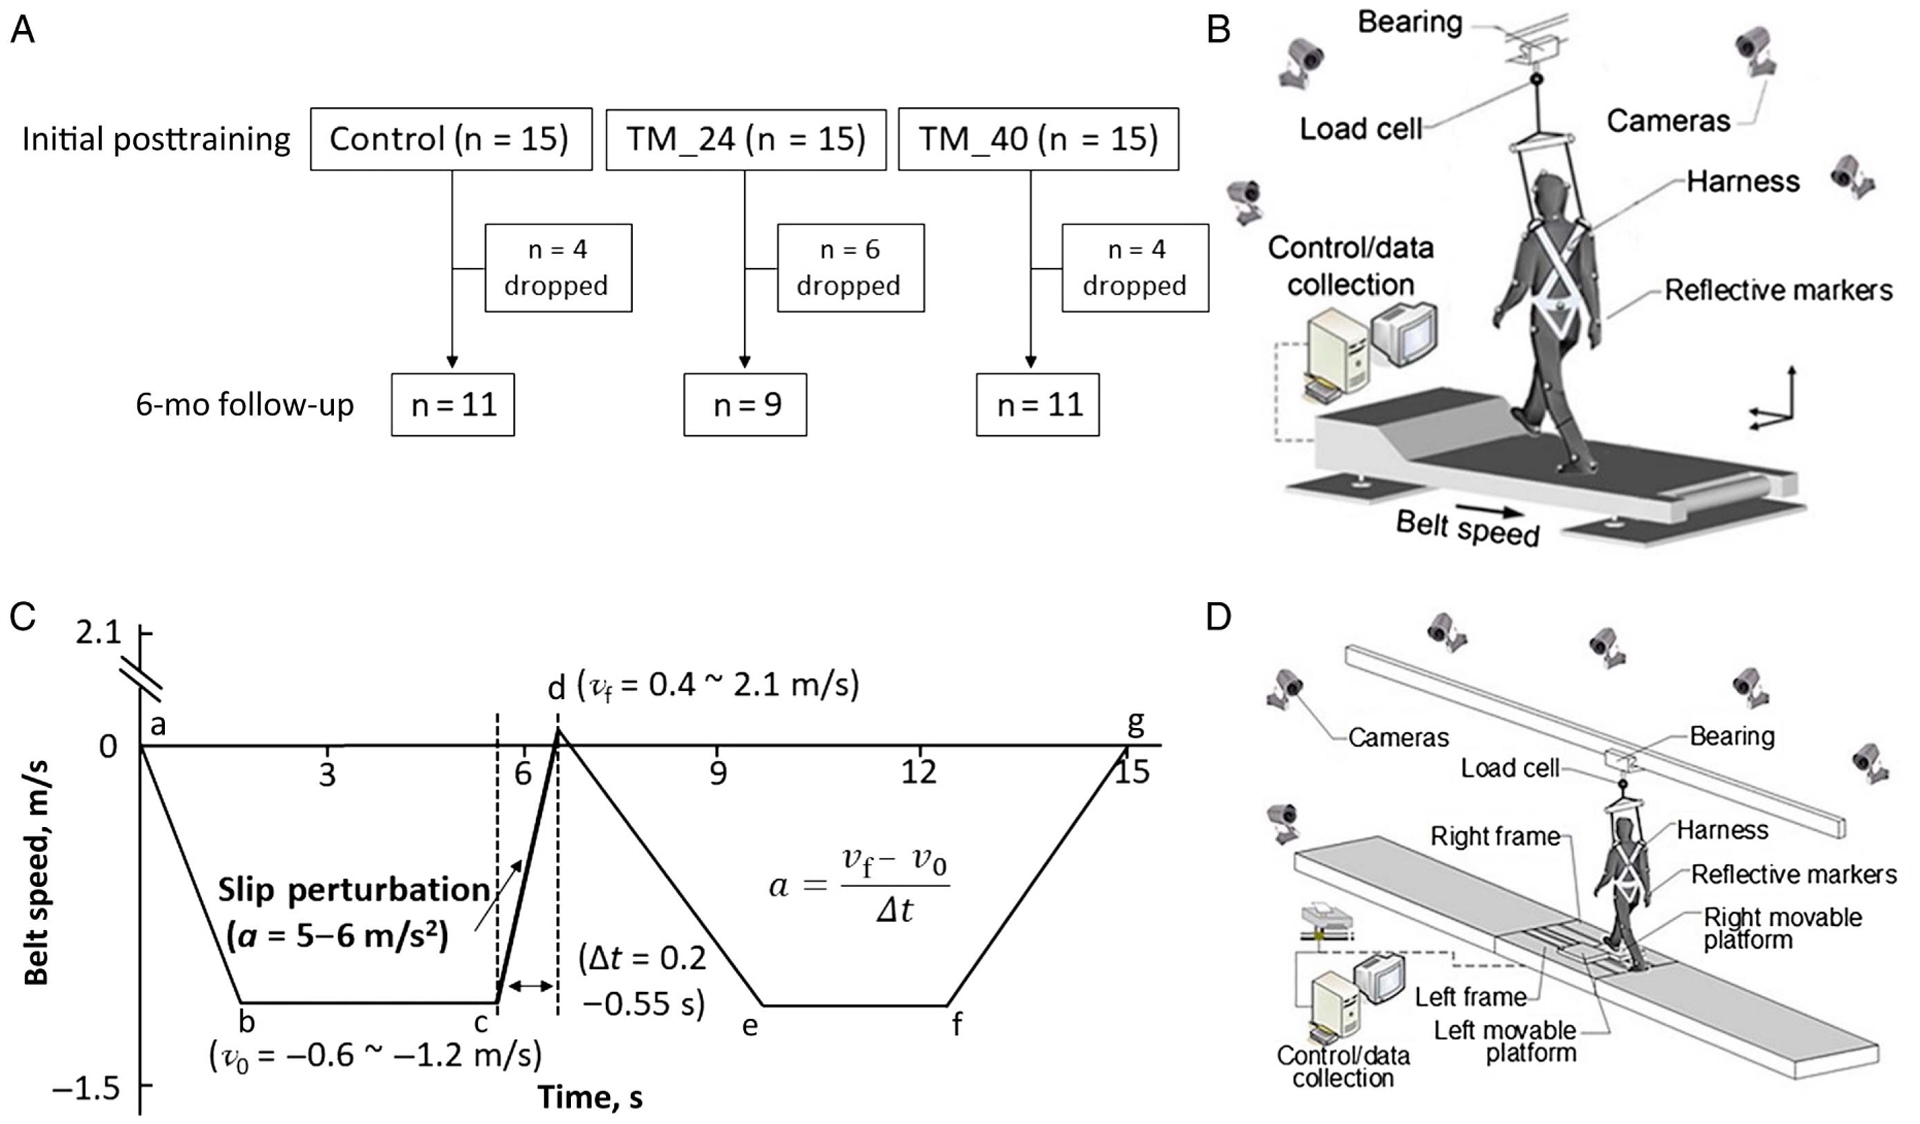
Figure 1 —

(A) Flow chart of participants in the study; schematics of (B) the treadmill that was used to produce the slip perturbation; (C) the profile of the treadmill slip perturbation; a–b indicates ramping-up duration, b–c indicates steady state of walking duration, c–d indicates slip-perturbation duration, d–e indicates returning duration to steady state of walking, e–f indicates steady state of walking duration, and f–g indicates ramping-down duration; (D) the overground walkway with movable platforms to test the generalization of the treadmill slip-perturbation training.
