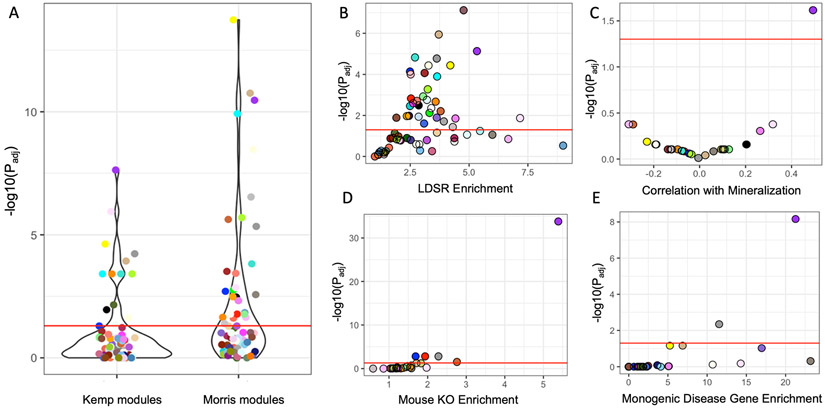
Figure 3. The purple module was the only core module after increasing the number of analyzed GWAS associations by 3.5-fold.
(A) A greater number of modules (N = 65) were identified as enriched for GWAS implicated genes in the Morris et al. GWAS versus the Kemp et al. GWAS. (B) Module enrichments for partitioned BMD heritability for each module determined using stratified LD score regression. (C) Correlation between each module eigengene and in vitro mineralization. Related to figure S2. (D) Module enrichments for genes that, when knocked out, produced a bone phenotype and (E) human monogenic bone disease genes. Red line in each panel represents Padj < 0.05. The most highly connected genes in the purple module also have higher alizarin red correlations and are more likely to be implicated by BMD GWAS. See also Figures S1 and S2.

