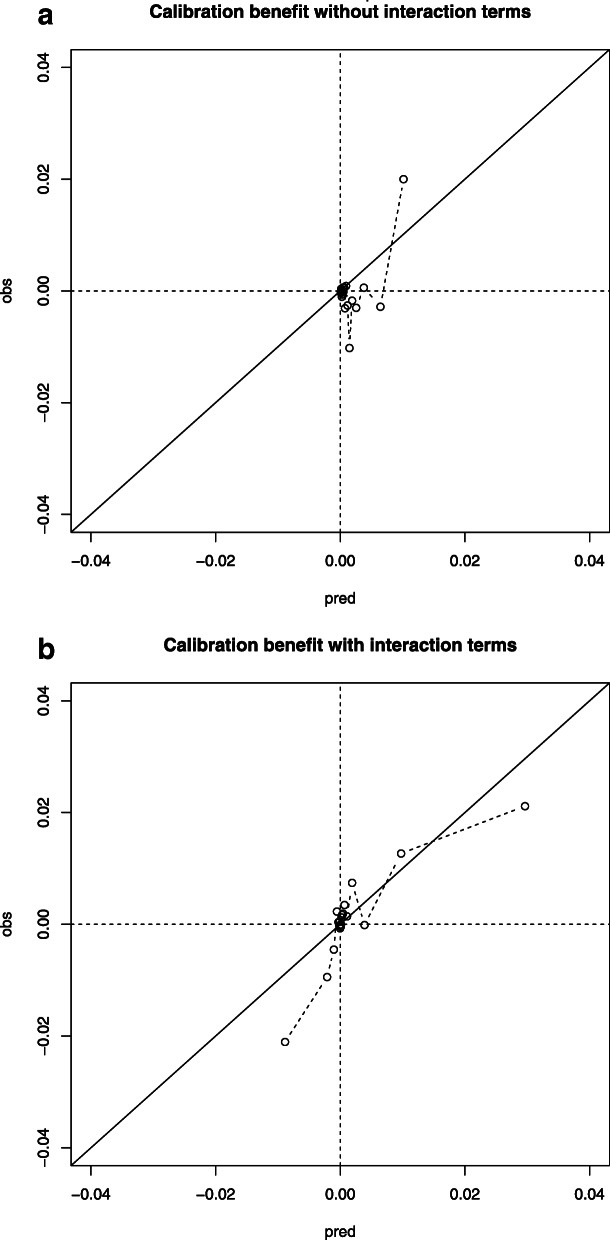
Fig. 3.
Calibration of benefit, for both the model with (B) and without interaction terms (A). Calibration of benefit is plotted with the predicted absolute treatment benefit on the x-axis and observed absolute treatment benefit on the y-axis. The study population was therefore divided in 20 equal groups based on the predicted absolute treatment benefit. A predicted absolute benefit of 1% (0.01) for a particular patient means 1% less mortality when this particular patient is brought to a Level-1 trauma center instead of a Level-2/3 trauma center

