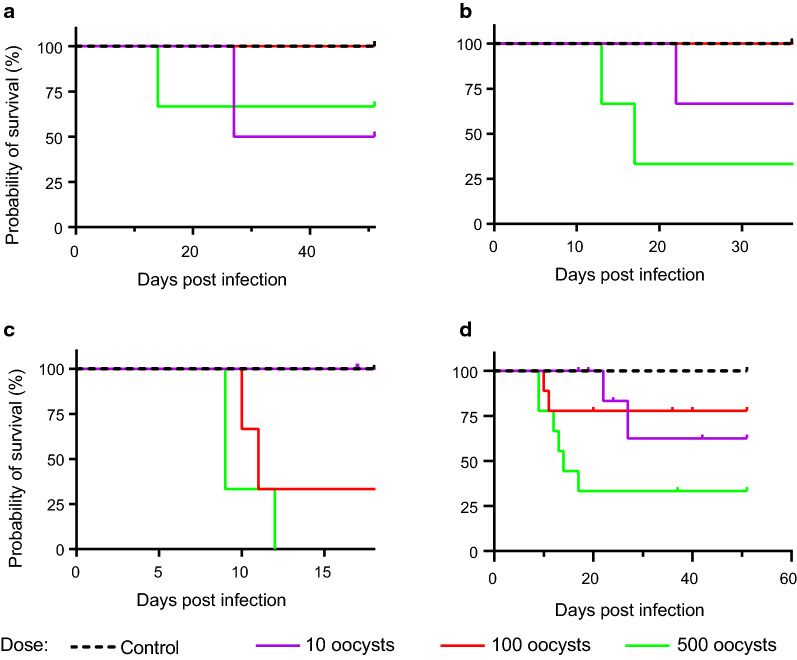
Fig. 2.
Impact of the infection dose on the dam survival rate. Kaplan-Meier survival rate of dams of the control and different infection groups. Animals were infected with 10 (purple solid line), 100 (red solid line) and 500 (green solid line) sporulated T. gondii oocysts on gestation day 15 (a), 30 (b) and 48 (c). Animals of the control group (black dashed line) were administered PBS. For each dam, the day of death, euthanasia, delivery or abortion was recorded. Merged data of (a–c) are shown in (d). Statistically significant differences between groups were as follows: (c) P < 0.05, comparing control and 500; (d) P < 0.05, comparing 10 and 500

