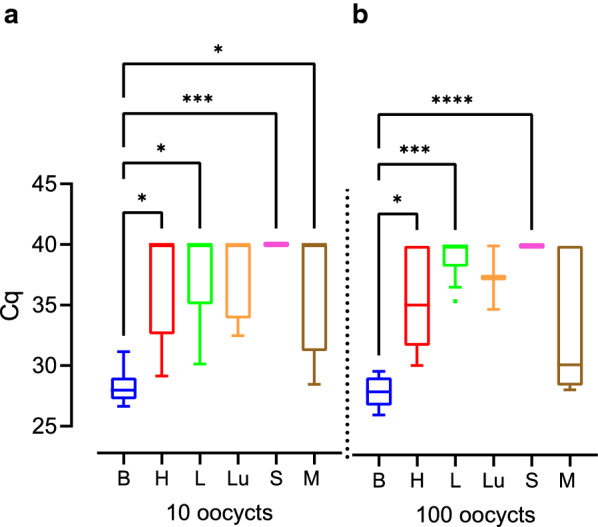
Fig. 9.

Impact of the infection dose on Cq values for Toxoplasma gondii DNA in the offspring. Cq values measured in various offspring tissues and organs, of which dams were infected for 34 to 51 days, with different T. gondii doses. Solid lines indicate comparison of different offspring organs obtained from dams infected with the same inoculation dose. Dashed lines indicate comparison of the same tissue and organ between different inoculation doses. *P < 0.05, **P < 0.01, ***P < 0.001, ****P < 0.0001. B brain, H heart, L liver, Lu lung, S spleen, M femoral muscles
