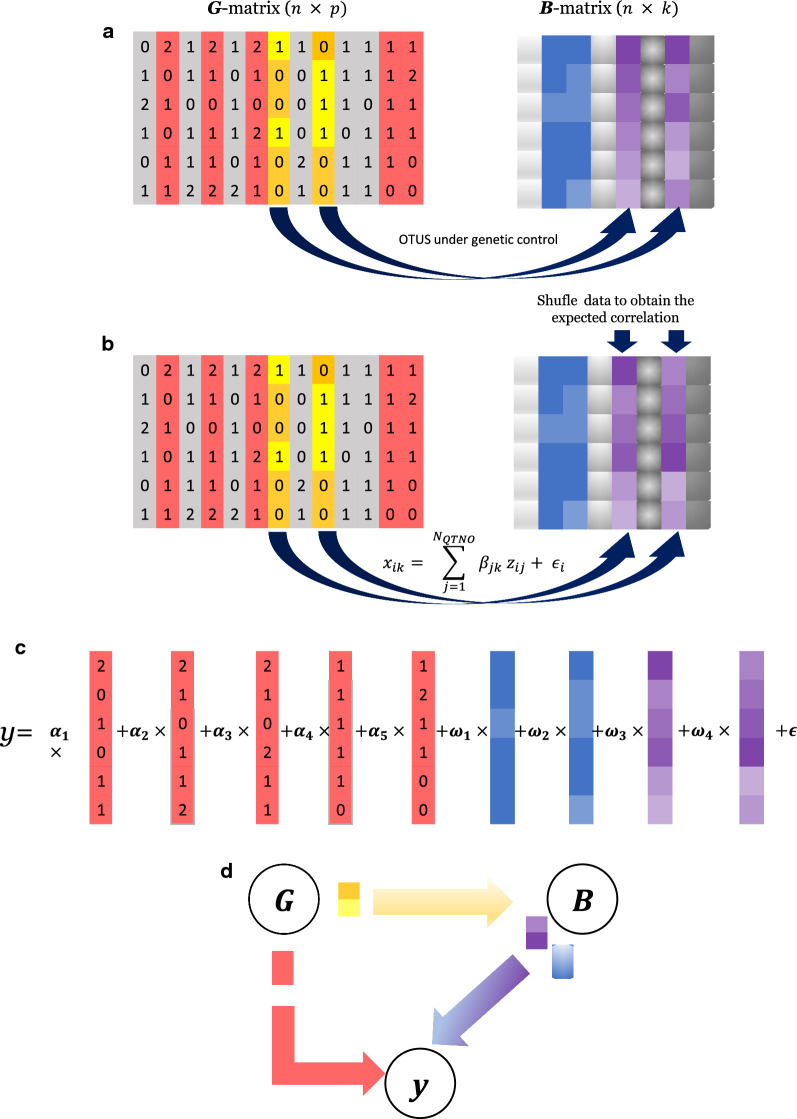
Fig. 1.
Representation of the scenarios evaluated. G: genome, typically comprises SNP genotype data; B: microbiome; y: phenotype of interest; arrows indicate causality. An arrow from G to y indicates that there is a subset of elements of G (causative SNPs) that influence y; an arrow from G to B indicates that there is a subset of G that influences a subset of abundances in B, which, in turn, may also influence y. An arrow departing from B indicates there is a subset of microbial abundances (the causative abundances) that influence y. The SNPs that affect B need not necessarily be the same as SNPs that affect y directly in the Recursive scenario. Note that B can contain one or more sets of abundances such as archaea and bacteria communities, or different time or site sampling points. Without loss in generality, we assume B is a single community

