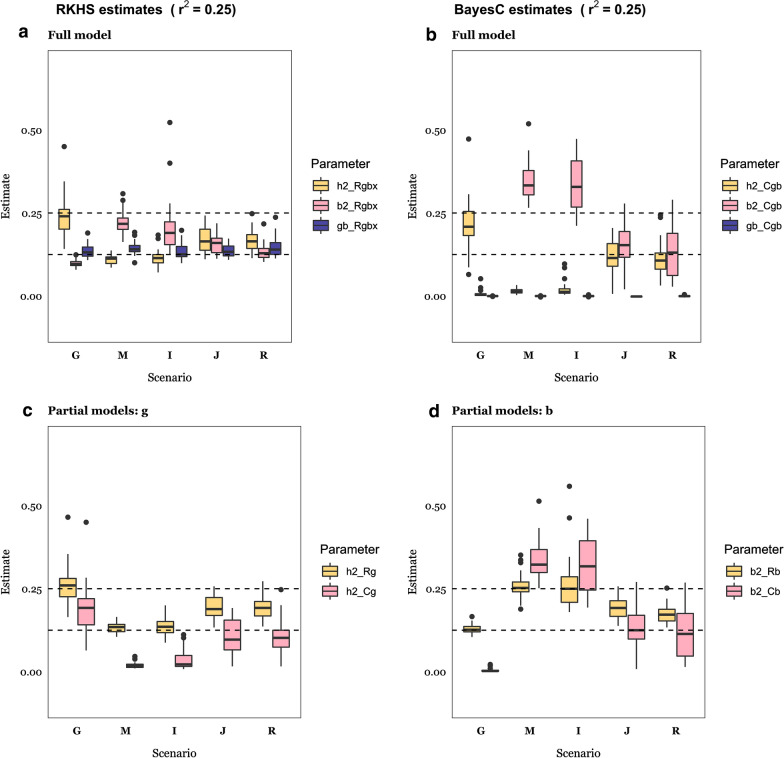
Fig. 6.
Parameter estimates for = 0.25. Estimates of heritability (), microbiability (), and the correlation between the genome and microbiome () for each of the RKHS (Bayes C) analysis models: model Rgbx includes microbiome and genome data, and their interaction; Cgb includes genome and microbiome data; Rg (Cg) includes genome data only, and Rb (Cb) includes microbiome data only). Details of simulation scenarios are in Table 1: G: Genome scenario; M: Microbiome; I: Indirect; J: Joint; R: Recursive. The horizontal dashed lines indicate simulated or parameter values (0.125, 0.25 depending on the scenario). Results are an average of 30 replicates

