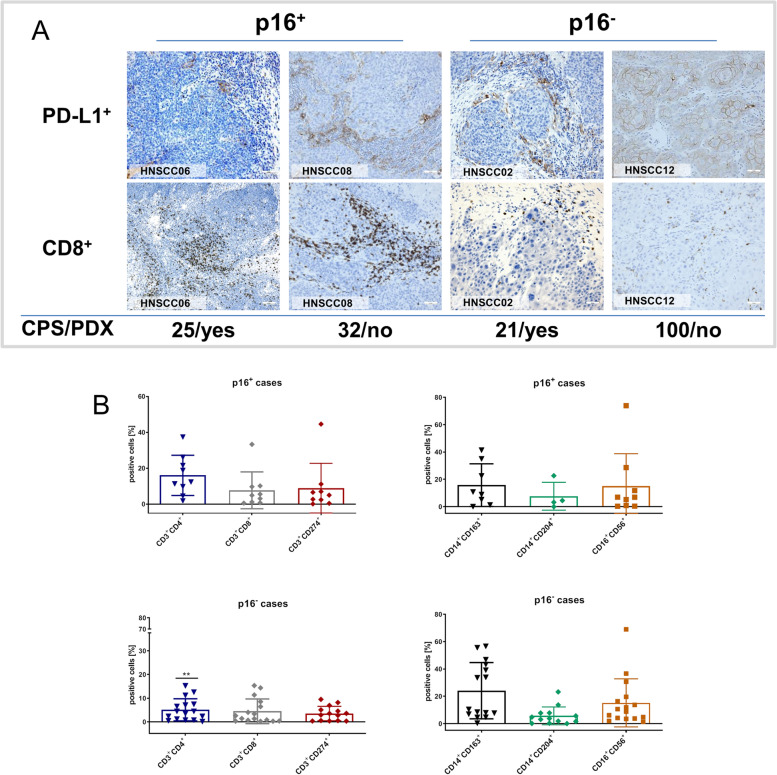
Fig. 6.
Tumor microenvironment phenotyping by flow cytometry and immunohistochemistry of p16+ and p16− HNSCC. A Scatterplot depicting the percentage number of positive cells stained with the appropriate monoclonal antibodies followed by flow cytometric analysis and measuring 50,000 events in a live gate. Data analysis was performed using BD FACSuite software. HNSCC cases were separated according to the p16 status (i.e. p16+ of p16−). The number of tumor-infiltrating macrophages (CD14+CD163+ and CD14+CD204+) correlated with engraftment success. **p < 0.01 p16+ tumors vs. p16− tumors; Mann Whitney U test. B Representative images showing PD-L1+ tumor and immune cells as well as infiltrating CD8+ cells in primary tumors. Tumor resection specimens were stained with the appropriate antibodies as stated in material & methods. The combined positive score (CPS) was calculated considering PD-L1 positivity in tumor and tumor-infiltrating immune cells. Additional information on engraftment success is given in the lower part (PDX – patient derived xenograft)

