. 2021 Jul 9;3(4):e210010. doi: 10.1148/rycan.2021210010

Figure 6:

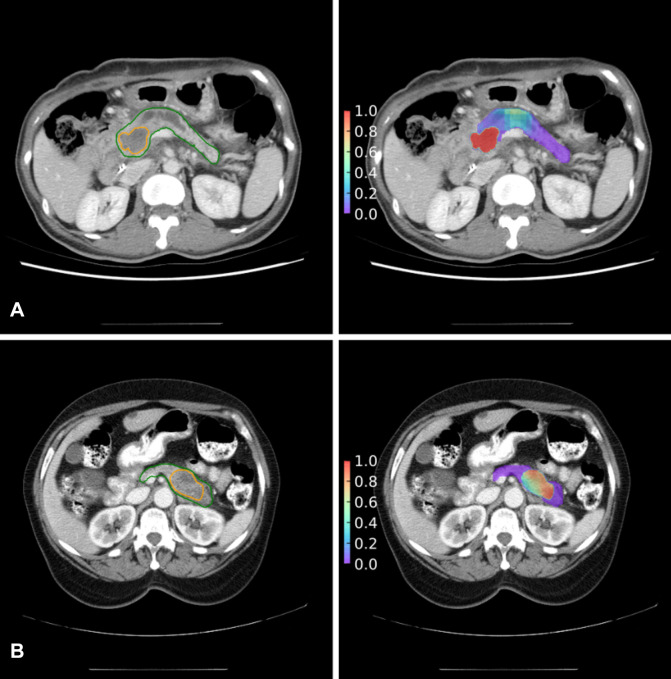
Correspondence in tumor location between model prediction (right panels) and radiologists’ labeling (left panels). Tumors are from the (A) local test set and (B) external test set. Areas encircled in the left panels are the cancer (orange) and pancreas (green) labeled by radiologists. Heatmaps (right panels) are constructed with the probabilities of cancer predicted by the generalized model.

Correspondence in tumor location between model prediction (right panels) and radiologists’ labeling (left panels). Tumors are from the (A) local test set and (B) external test set. Areas encircled in the left panels are the cancer (orange) and pancreas (green) labeled by radiologists. Heatmaps (right panels) are constructed with the probabilities of cancer predicted by the generalized model.