. 2021 Jun 25;3(4):e200069. doi: 10.1148/rycan.2021200069

Figure 5:

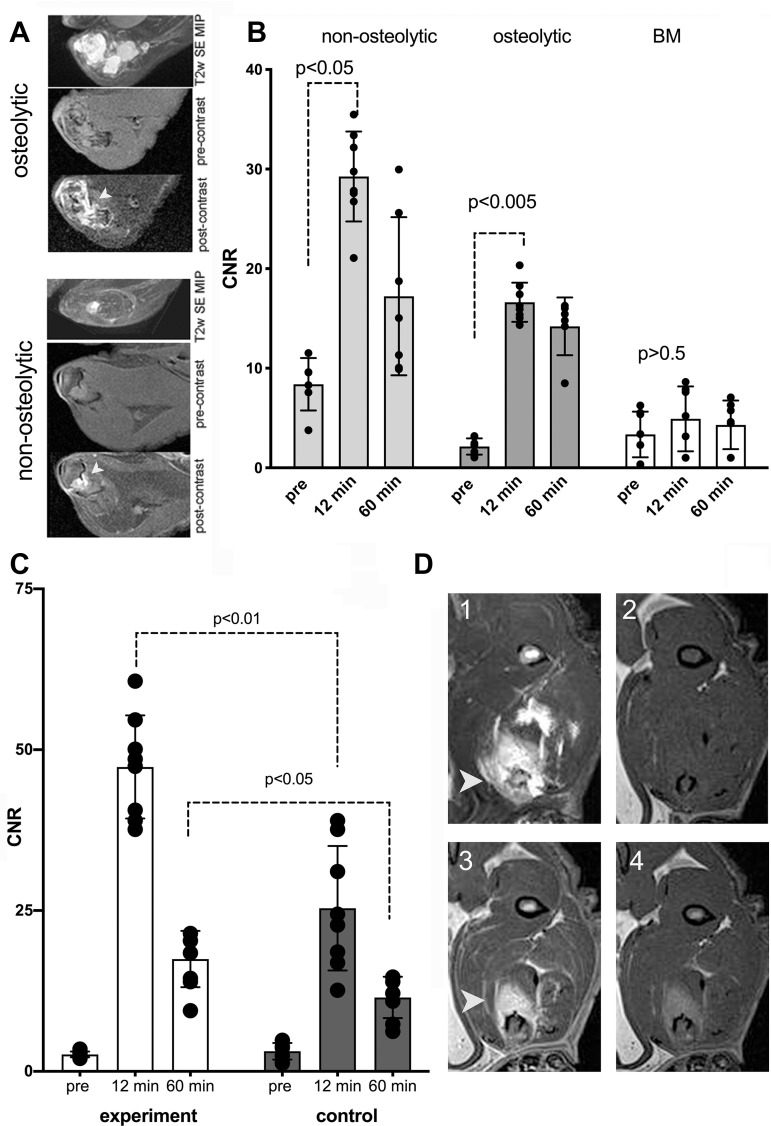
(A–D) MRI scans and graphs show osteolytic and nonosteolytic bone tumors with gadolinium(III)-mono-5-hydroxytryptamide of 2,2′,2′′-(10-(2,6-dioxotetrahydro-2H-pyran-3-yl)-1,4,7,10-tetraazacyclododecane-1,4,7-triyl)triacetic acid) (Gd-5HT-DOTAGA). (A) Comparative morphologic structure of representative osteolytic and nonosteolytic bone firefly luciferase+MDA-MB-231 tumors shown as T2-weighted (T2w) spin-echo (SE) maximum intensity pixel (MIP) projection images and T1-weighted spin-echo pulse sequence 3.0-T MRI scans acquired in-section pre-Gd-5HT-DOTAGA (pre-contrast) and after Gd-5HT-DOTAGA (post-contrast) (0.15 mmol/kg) administration. The animals were preinjected with a mixture of anti-epidermal growth factor receptor (EGFR)-F(ab’)2-horseradish peroxidase (HRP) and anti-EGFR-F(ab’)2-glucose oxidase (GOx) conjugates before Gd-5HT-DOTAGA injection. (B) Dynamic contrast enhancement in tumors (at 3.0-T MRI) expressed as contrast-to-noise (CNR) ratio. CNR of bone tumor images in animals preinjected with anti-EGFR conjugates before (pre) and 12 and 60 minutes after injection of Gd-5HT-DOTAGA. CNR in animals with CT-confirmed osteolysis and nonosteolytic tumors are shown compared with normal bone marrow (BM) enhancement. Mean data are ± standard deviation (four tumors per group, two to three MRI sections per animal). (C) CNR of tumors in experimental and control groups (three tumors per group, two to three MRI sections per animal); MRI was performed at 7.0 T. Control group animals were preinjected with a blocking dose of cetuximab (5 mg/kg) before injection of a mixture of anti-EGFR-F(ab’)2-HRP and anti-EGFR-F(ab’)2-GOx conjugates. Significant differences were observed at 12 minutes (first T1-weighted spin-echo pulse sequence acquisition) and at 60 minutes after injection of Gd-5HT-DOTAGA (0.2 mmol/kg). (D) Representative 7.0-T MRI scans of invasive tumor: (1) T2-weighted spin-echo maximum intensity pixel projection, (2) pre-Gd-5HT-DOTAGA injection T1-weighted spin echo, (3) 12 minutes after Gd-5HT-DOTAGA injection T1-weighted spin echo, (4) 60 minutes after Gd-5HT-DOTAGA injection T1-weighted spin echo. Arrowheads point to the tumor in panels A and D.

(A–D) MRI scans and graphs show osteolytic and nonosteolytic bone tumors with gadolinium(III)-mono-5-hydroxytryptamide of 2,2′,2′′-(10-(2,6-dioxotetrahydro-2H-pyran-3-yl)-1,4,7,10-tetraazacyclododecane-1,4,7-triyl)triacetic acid) (Gd-5HT-DOTAGA). (A) Comparative morphologic structure of representative osteolytic and nonosteolytic bone firefly luciferase+MDA-MB-231 tumors shown as T2-weighted (T2w) spin-echo (SE) maximum intensity pixel (MIP) projection images and T1-weighted spin-echo pulse sequence 3.0-T MRI scans acquired in-section pre-Gd-5HT-DOTAGA (pre-contrast) and after Gd-5HT-DOTAGA (post-contrast) (0.15 mmol/kg) administration. The animals were preinjected with a mixture of anti-epidermal growth factor receptor (EGFR)-F(ab’)2-horseradish peroxidase (HRP) and anti-EGFR-F(ab’)2-glucose oxidase (GOx) conjugates before Gd-5HT-DOTAGA injection. (B) Dynamic contrast enhancement in tumors (at 3.0-T MRI) expressed as contrast-to-noise (CNR) ratio. CNR of bone tumor images in animals preinjected with anti-EGFR conjugates before (pre) and 12 and 60 minutes after injection of Gd-5HT-DOTAGA. CNR in animals with CT-confirmed osteolysis and nonosteolytic tumors are shown compared with normal bone marrow (BM) enhancement. Mean data are ± standard deviation (four tumors per group, two to three MRI sections per animal). (C) CNR of tumors in experimental and control groups (three tumors per group, two to three MRI sections per animal); MRI was performed at 7.0 T. Control group animals were preinjected with a blocking dose of cetuximab (5 mg/kg) before injection of a mixture of anti-EGFR-F(ab’)2-HRP and anti-EGFR-F(ab’)2-GOx conjugates. Significant differences were observed at 12 minutes (first T1-weighted spin-echo pulse sequence acquisition) and at 60 minutes after injection of Gd-5HT-DOTAGA (0.2 mmol/kg). (D) Representative 7.0-T MRI scans of invasive tumor: (1) T2-weighted spin-echo maximum intensity pixel projection, (2) pre-Gd-5HT-DOTAGA injection T1-weighted spin echo, (3) 12 minutes after Gd-5HT-DOTAGA injection T1-weighted spin echo, (4) 60 minutes after Gd-5HT-DOTAGA injection T1-weighted spin echo. Arrowheads point to the tumor in panels A and D.