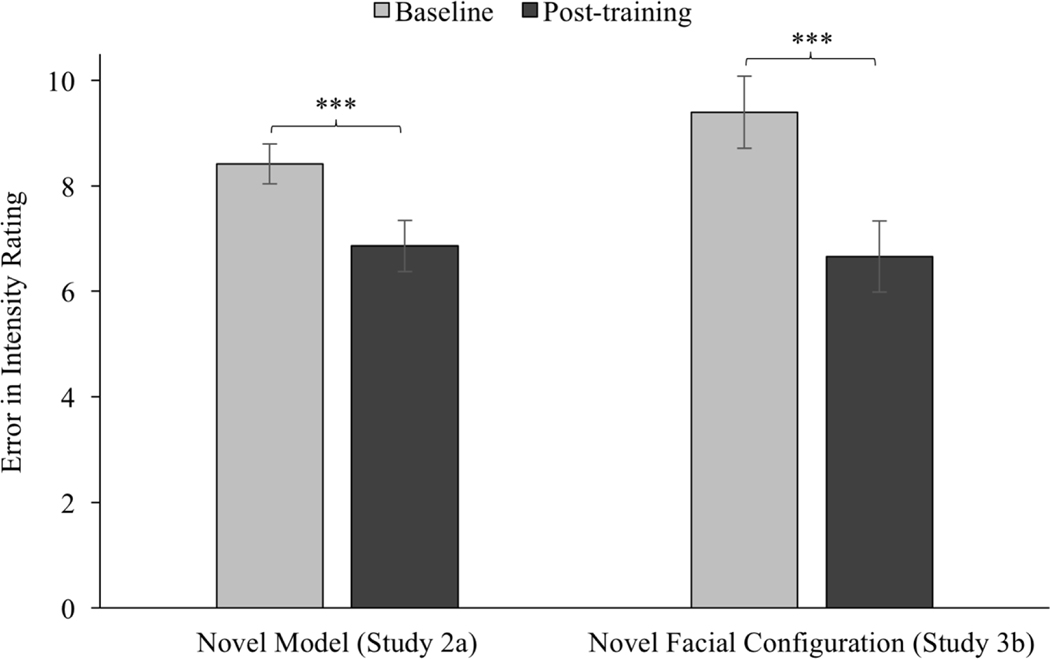
Figure 5.
Change in error in intensity ratings for those trained and tested on different models or facial configurations. In Study 2a, participants completed baseline and post-training on one model with training on another; Study 3b involved training on anger/happiness facial configurations and baseline and post-training assessment on fear/happiness or sadness/happiness facial configurations (same model). Scores for Study 3b are collapsed across ratings for fearful and happy and sad and happy facial prototypes. Lower values indicate less error; a score of zero indicates no error relative to actual percent morph. Error bars indicate 95% confidence intervals. *** p < .001.

