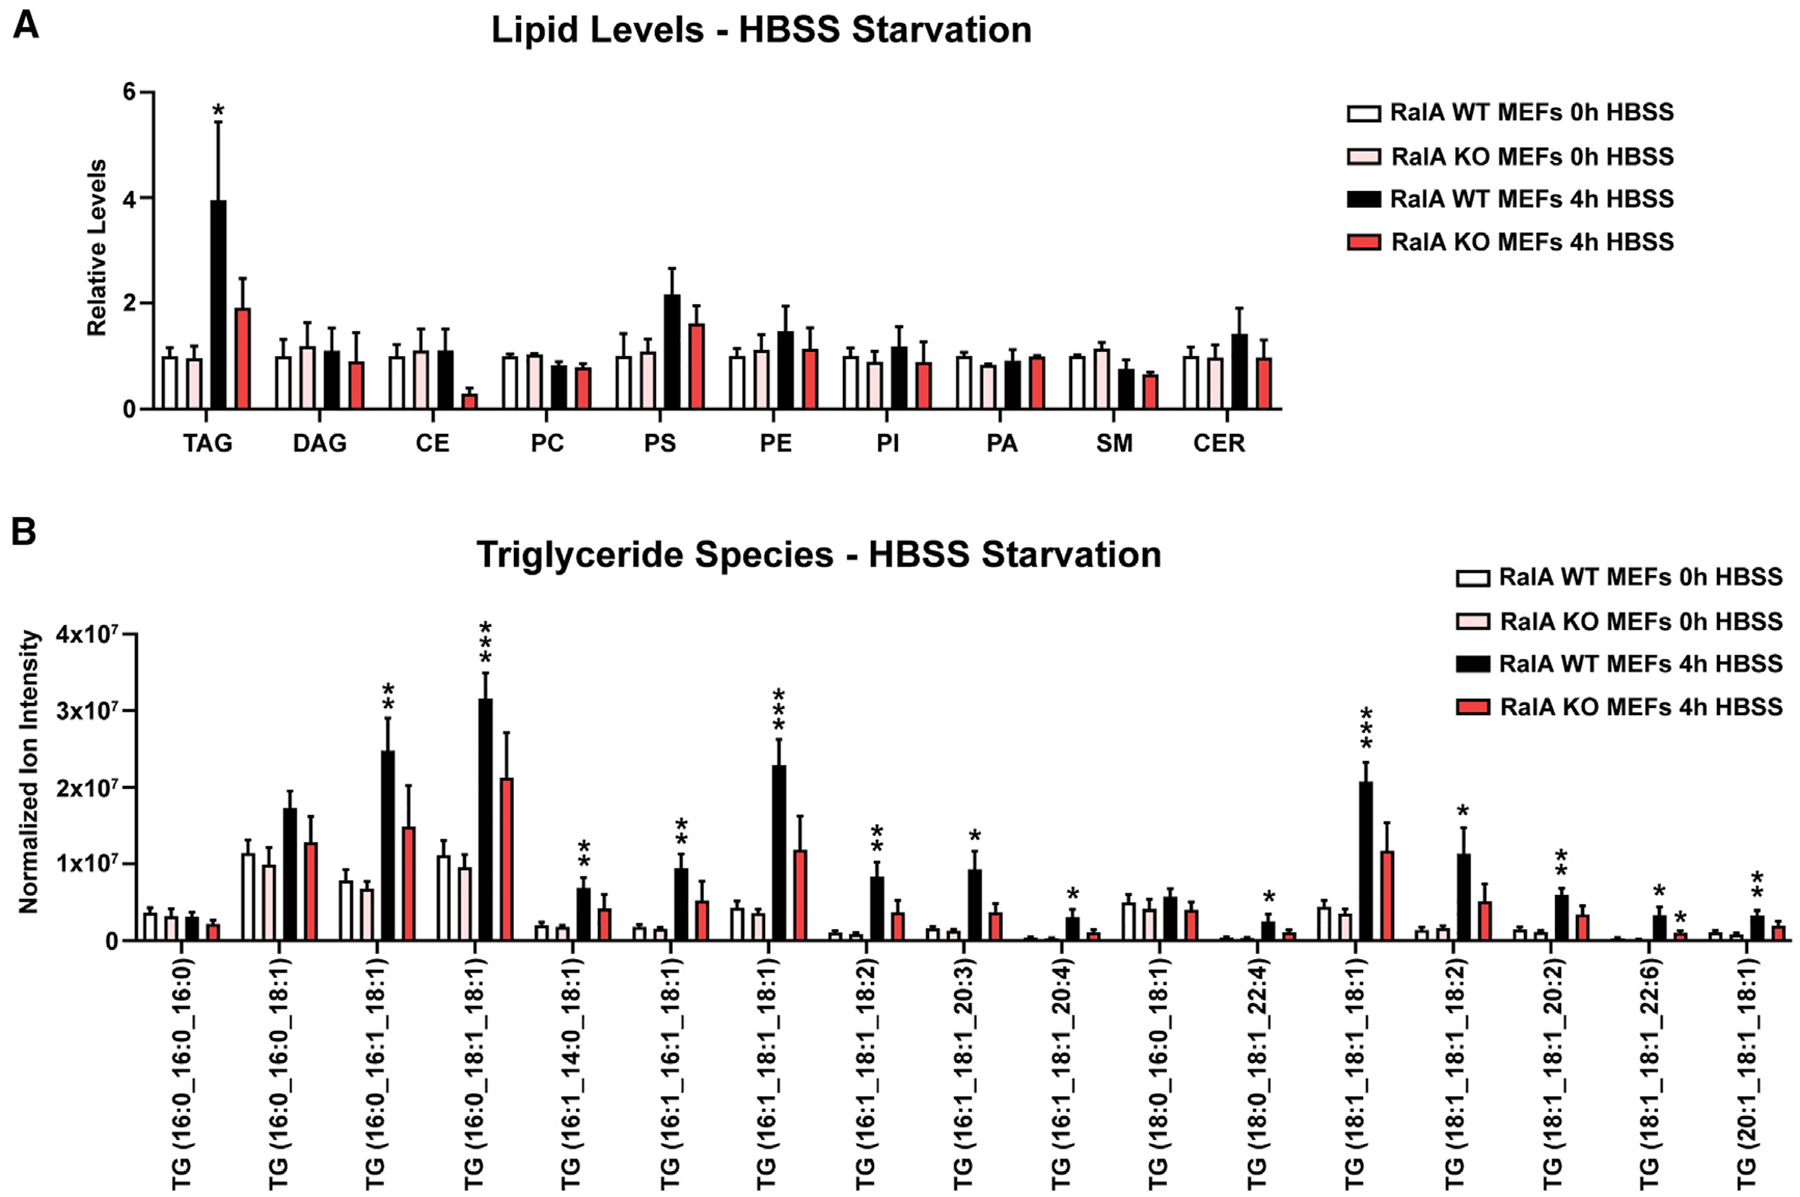
Figure 2. Analysis of lipid composition in nutrient-starved MEFs.

MEFs were incubated in either DMEM (0 h) or HBSS (4 h) for 4 h; lipids were extracted by a modified Folch method and analyzed by liquid chromatography-tandem mass spectrometry (LC-MS/MS).
(A) Relative levels of various lipids in MEFs. Raw values were normalized to cell counts taken prior to lipid extraction. n = 5. Two-way ANOVA using Tukey’s multiple comparisons test was done for each set of individual lipid type. mean ± SEM. *p < 0.05.
(B) Normalized ion intensity values for the most-abundant individual TAG species detected. Raw values were normalized to cell counts taken prior to lipid extraction. Separate multiple t tests were used to compare 0-h and 4-h WT MEFs and 0-h and 4-h RalA KO MEFs. n = 5. mean ± SEM. *p < 0.05, **p < 0.01, ***p < 0.001.
See also Figure S2.
