
Figure 1 .
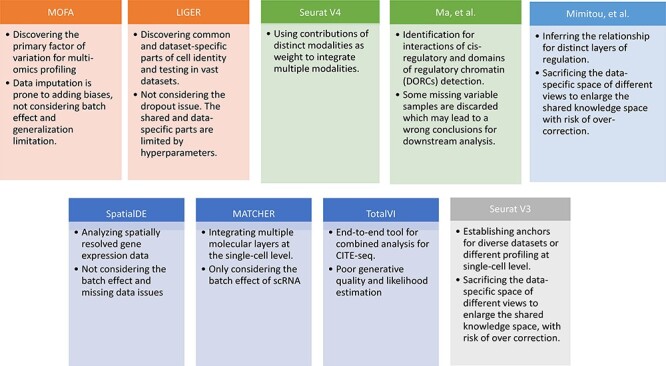
Advantages and disadvantages of nine single-cell multi-omics data analysis tools. The primary advantage and disadvantage of each method is represented by the 1st and 2nd points in each box, respectively. Orange denotes matrix decomposition, green denotes graph-based methods, light blue denotes clustering methods, navy blue denotes variational inference and gray denotes the CCA method. LIGER has employed both matrix decomposition and graph-based algorithms.