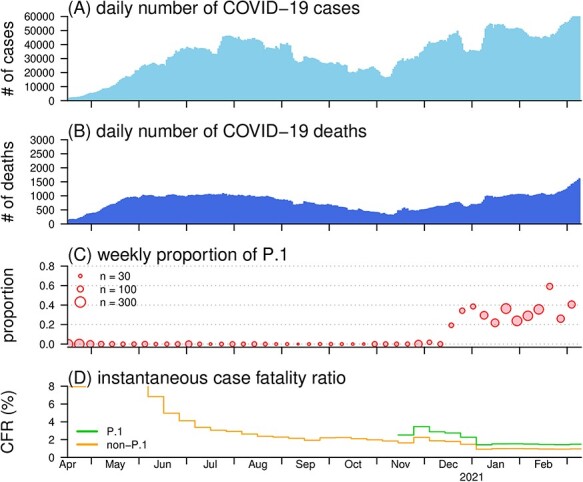
Figure 1.

The daily number of COVID-19 cases (A) and deaths (B), proportion of the P.1 SARS-CoV-2 variants (C), and the reconstructed CFR (D) in Brazil. Panel (A) and (B) show the daily number of COVID-19 cases and deaths time series in Brazil, respectively. Panel (C) shows the observed proportion of P.1 variants among all samples of SARS-CoV-2 strains. In the legend, the size of the dot indicates the weekly sample size of the observed SARS-CoV-2 strains. Panel (D) shows the reconstructed CFR of P.1 (in green) and CFR of non-P.1 (in orange)
