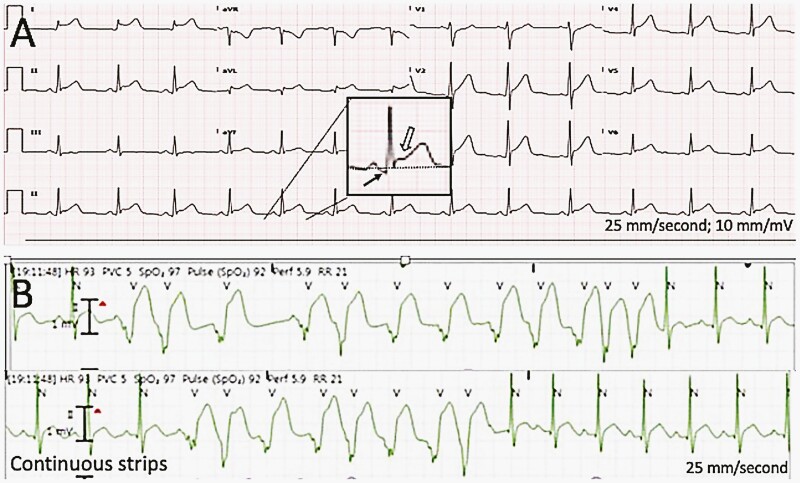
Figure 1.
(A) Twelve lead electrocardiogram from patient 2, demonstrating sinus rhythm with normal axis and intervals. Diffuse PR depressions and horizontal ST-segment elevations are illustrated in the magnified inset as black and white arrows, respectively. The dotted line represents the baseline. These findings are typical in patients with pericarditis. (B) A continuous telemetry strip demonstrating 2 episodes of irregular, polymorphic ventricular tachycardia from patient 4. N represents the normal QRS, and V represents the ventricular ectopic beats.

