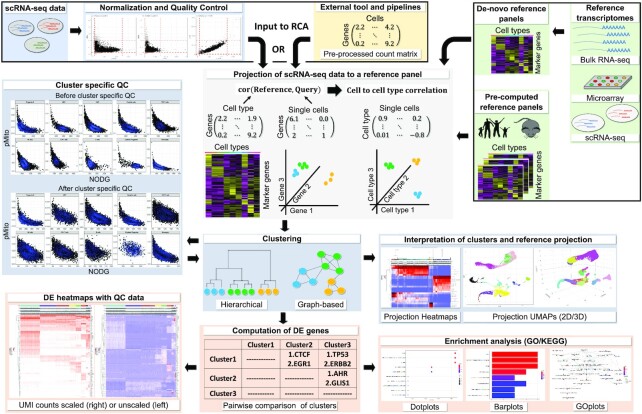
Figure 1.
RCA2 takes two types of scRNA-seq data as input: (i) CellRanger output files and (ii) data preprocessed elsewhere, which can be loaded as a gene × cell count matrix. Reference datasets in RCA2 for human and mouse are based on bulk RNA-seq, microarray and scRNA-seq assays. RCA2 can also generate custom reference panels from user-supplied raw count matrices. RCA2 computes a correlation matrix representing the similarity of each SC transcriptome to each reference transcriptome. Correlations are calculated using marker (DE) genes from the reference panel. Cells are clustered and visualized in the space of reference projections. After DE gene analysis, enriched GO terms and KEGG pathways can be identified.

