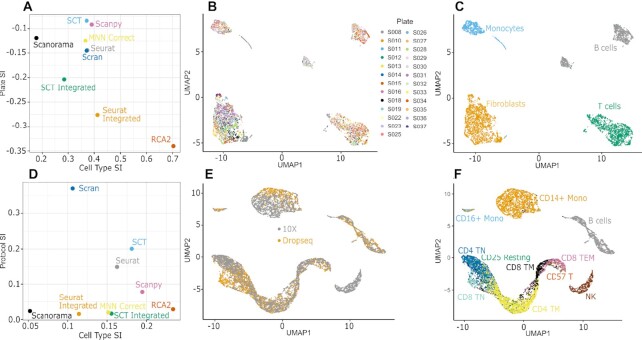
Figure 3.
(A) Silhouette Index (SI) measuring separation of cells in RA data by plate and cell type. (B, C) UMAP visualization of RCA2 clustering of RA data colored by (B) plate and (C) cell type. (D) SI measuring separation of cells in CITE-Seq data by protocol and cell type. (E, F) UMAP visualization of RCA2 clustering of CITE-Seq data colored by (E) protocol and (F) cell type.

