Figure 5.
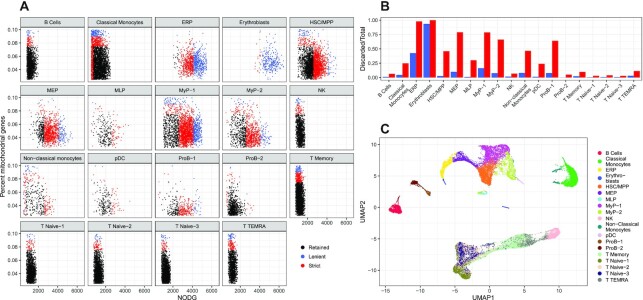
(A) Cluster-specific QC based on NODG and pMito. Colors indicates whether cells are discarded (red, blue) or retained (black) if general, cluster-unspecific QC would be used. (B) Proportions of cells discarded per cell type using cluster unspecific QC. (C) UMAP reduction of a multi panel RCA2 projection coloured by cell type using a resolution of 0.5.

