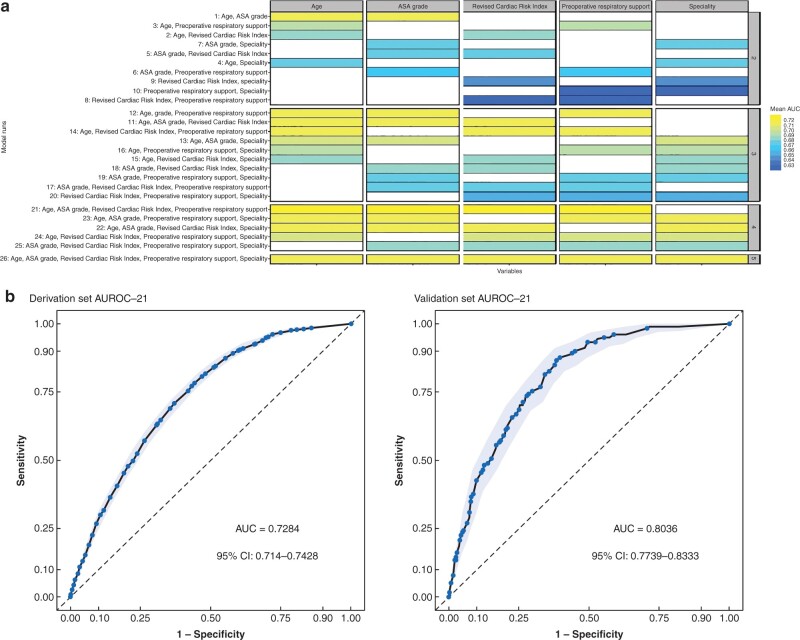
Fig. 2.
Model performance and evaluation.
a Logistic model performance of all different runs divided by each of the features. Colour coded according to performance values (mean area under the curve (AUC) of 100 bootstraps). b Receiver operating characteristic curves for model evaluation. After generating the final model made up by the averaged coefficients of the bootstraps of run 21, it was evaluated in both the derivation set as a whole (Area under receiver operating characteristic curve (AUROC) = 0.7284, 95 per cent c.i. 0.7140 to 0.7428) and the validation set AUROC = 0.8036, 95 per cent c.i. 0.7739 to 0.8333). Results are depicted with AUROC and confidence intervals generated through the pROC and plotROC packages. 95 per cent confidence intervals were computed with default 2000 stratified bootstrap replicates.

