
Figure 1.
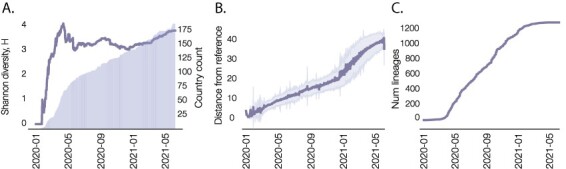
(A) Time series of the number of countries that have reported SARS-CoV-2 genome sequences (shaded area) and a curve showing trends in the geographic variation of reporting, quantified as the Shannon diversity (H) of sequence sampling location labels (curved). (B) The accumulation of SARS-CoV-2 genetic diversity over time, measured as the mean genetic distance of sampled sequences from the reference sequence (accession: EPI_ISL_406801). Shaded regions indicate one standard deviation from the mean. (C) Number of designated Pango lineages over the course of the pandemic. As more countries have contributed sequences, and as genetic diversity has accumulated throughout, the Pango nomenclature has continued to define distinct lineages that represent the emerging edge of the pandemic. SARS-CoV-2 genome sequences and metadata described were sourced from GISAID on 31 May 2021.