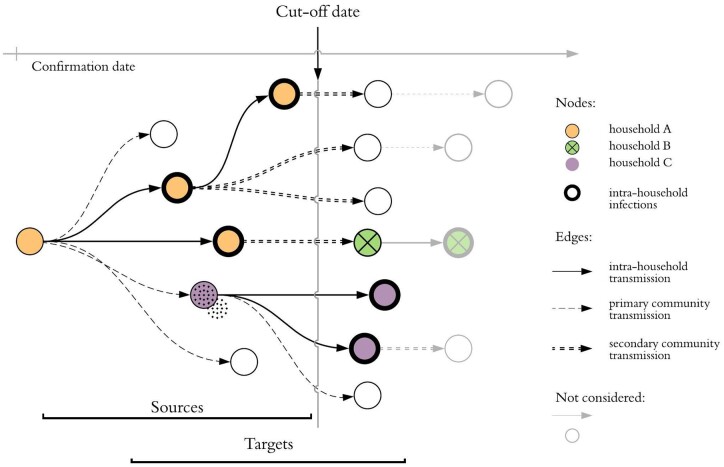
Figure 2.
Schematic infection graph: nodes represent positive cases and their horizontal position indicates confirmation date. We consider the subset of the graph containing cases with confirmation date prior to the cut-off date: target nodes are infected by sources. R can be estimated as R = (number of targets)/(number of sources) and hence R = 13/7 for this cluster. There are three distinct households in the cluster and thick borders denote secondary household infections. The household reproductive number is Rh = 5/7. R, reproduction number; Rh, intra-household reproduction number.

