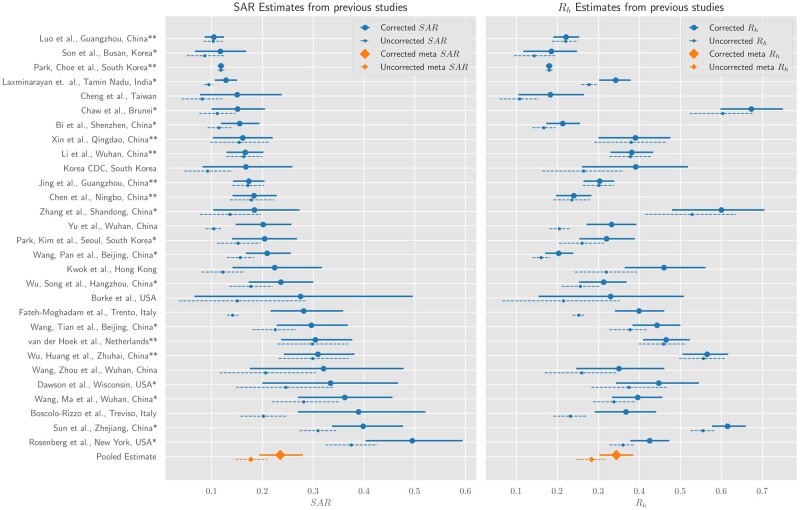
Figure 3.
Adjusted literature estimates for SAR and Rh. Dashed lines show estimates from the original studies. Solid lines show 95% credible intervals from a Bayesian hierarchical model, which adjusts estimates for false negatives and asymptomatics where appropriate. The meta-estimates refer to the pooled estimate for SAR and Rh. In the left plot, the meta-estimate (orange) are the model’s credible intervals for the pooled SAR. If a study has a single asterisk, this means it was unnecessary to adjust for asymptomatics (only false negatives). The double asterisk means no adjustment was necessary. Rh, intra-household reproduction number; SAR, household secondary-attack rate.

