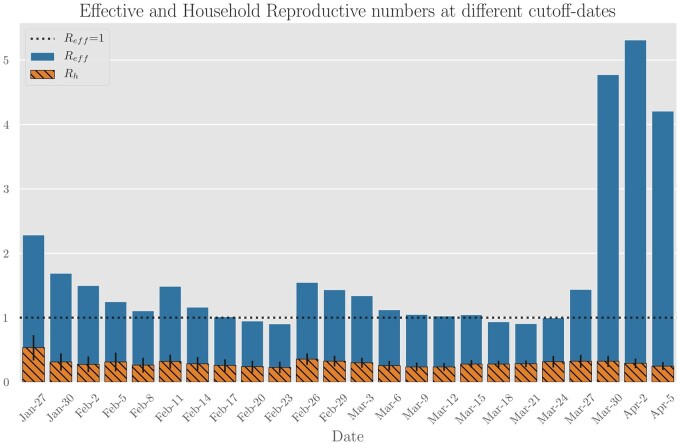
Figure 4.
Aggregate estimates of effective and household reproduction numbers in Singapore based on contact-tracing data while varying the cut-off date (i.e. the date after which source infections are ignored). Household transmission appears to stay constant, with the intra-household reproduction number in the 0.2–0.3 range. The ratio of infections attributable to households decreases sharply at the end of March due to large outbreaks in migrant-worker dormitories. Even though their infections are not annotated as households, this suggests that cohabitation and proximity play a large role in transmission dynamics.

