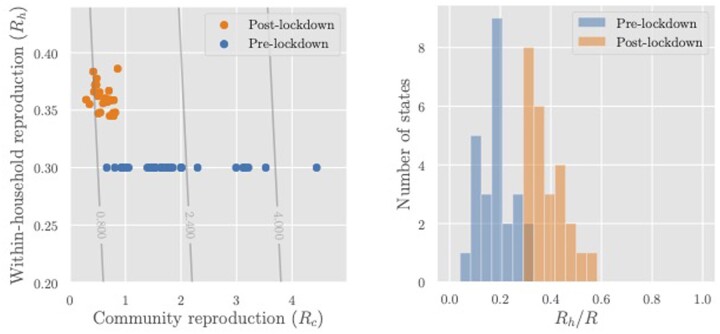
Figure 6.
Left: Reproduction numbers for community transmission (Rc) and intra-household transmission (Rh) for the regions whose R values are shown in Figure 4. The overlaid contour plot shows level sets of the overall reproduction number R = Rh + Rc. Right: Estimated share of transmission attributable to household infections (Rh/R). In both graphs, Rh = 0.3 pre lockdown is assumed. Post-lockdown Rh of an area is calculated by multiplying the pre-lockdown value with a mobility factor M obtained from Google’s estimates of the average time spent in residential areas. Rc, community reproduction number; Rh, intra-household reproduction number; R, reproduction number; M, mobility factor (increase in mobility post lockdown).

