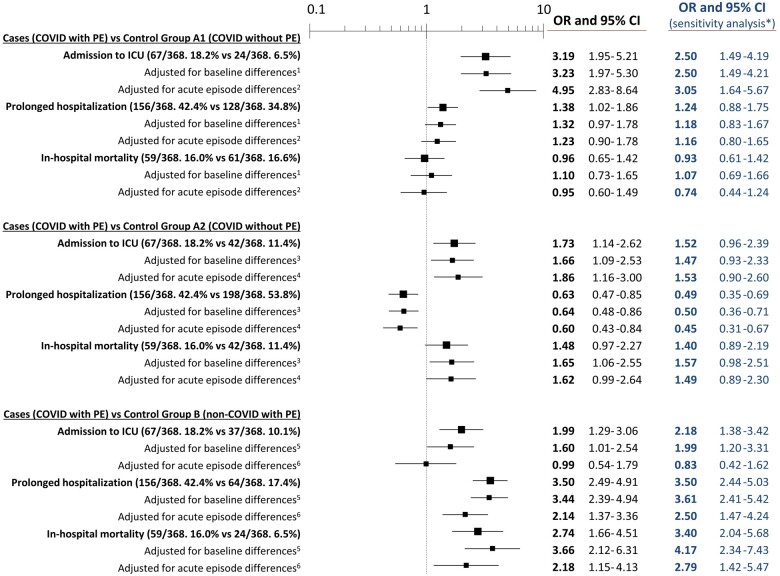
Figure 5.
Outcomes of patients with COVID-19 and pulmonary embolism compared with COVID-19 patients without pulmonary embolism (control groups A1 and A2) and non-COVID-19 patients with pulmonary embolism (control group B). *Sensitivity analysis is presented only by blue figures (no graphs) and was run using only patients with SARS-CoV-2 infection microbiologically confirmed in the case group (n = 271, 73.6%), control group A1 (n = 271, 73.6%) and control group A2 (n = 275, 74.7%). 1Adjusted for recent immobilization and chronic heart failure. 2Adjusted for dyspnoea, cough, fever, chest pain and leg swelling/pain as clinical complaints, lactate dehydrogenase, leucocytes, platelets, D-dimer, and ground-glass lung opacities on chest X-ray (missing values were replaced using multiple imputation). 3Adjusted for immunosuppressed and chronic heart failure. 4Adjusted by dyspnoea, cough, fever, chest pain, leg swelling/pain as clinical complaints, creatinine, D-dimer, and interstitial lung infiltrates and cardiomegaly on chest X-ray (missing values were replaced using multiple imputation). 5Adjusted for age, active cancer, recent immobilization, chronic oestrogen therapy, asthma, active smoker, and chronic heart failure. 6Adjusted for dyspnoea, cough, fever, diarrhoea and leg swelling/pain as clinical complaints, haemoglobin, D-dimer, and lung interstitial bilateral infiltrates and ground-glass opacities on chest X-ray (missing values were replaced using multiple imputation). CI, confidence interval; ICU, intensive care unit; OR, odds ratio; PE, pulmonary embolism.

