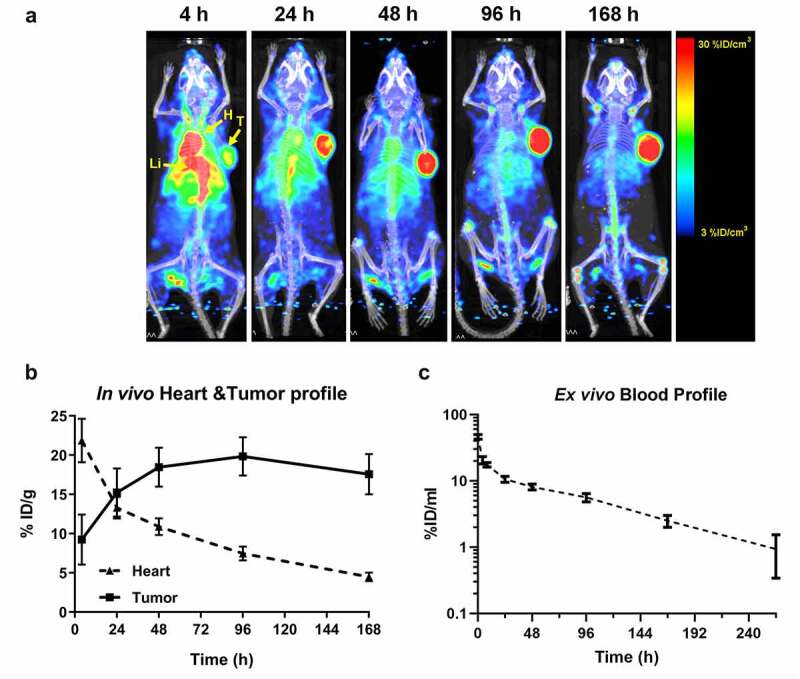
Figure 3.

In vivo biodistribution and tumor targeting by PET/CT imaging. (a) In vivo PET/CT imaging was performed in A375 tumor-bearing mice at 4, 24, 48, 96, and 168 h after injection of 89Zr-DFO-anti-IL13Rα2-Ab. Maximum Intensity Projection (MIP) images shown here represent whole-body biodistribution and tumor targeting at different timepoints. T – tumor; H – heart; Li – liver. (b) Quantitative profiling of tumor and heart uptake in vivo showing accumulation in tumor and clearance from heart. Here we use heart as a surrogate for evaluating probe distribution in blood. (c) Ex vivo blood quantitation by gamma counting showing biphasic clearance over time. N = 3– 6 mice per group for each timepoint; data are Mean ± SEM
