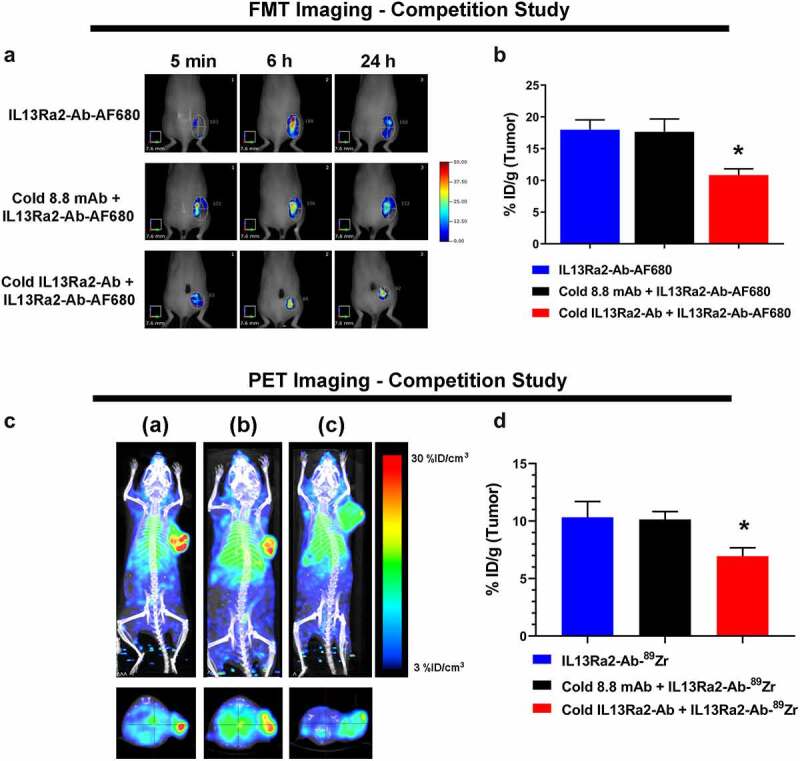
Figure 4.

Pharmacological competition showcases antigen specificity of the anti-IL13Rα2 Ab. (a) Representative in vivo FMT images with tumor ROIs at 5 min, 6, and 24 h after injection of anti-IL13Rα2-Ab-AF680 (3 mg/kg) with PBS or pretreatment of 30 mg/kg unlabeled isotype control 8.8-mAb or unlabeled anti-IL13Rα2-Ab in the A375 xenograft model. (b) Ex vivo quantification of tumor signal (%ID/g) at 24 h. (c) Representative in vivo PET/CT images (MIP) at 24 h after injection of 89Zr-DFO-anti-IL13Rα2-Ab (3 mg/kg) without pretreatment (a), or with pretreatment of 30× excess cold isotype control 8.8-mAb (b), or cold anti-IL13Rα2 Ab (c) in the A375 xenograft model. Top panel: coronal view; bottom panel: axial multiplanar reconstruction view. (d) Ex vivo gamma counting quantification of tumor uptake. N = 3– 5 mice per group; *, p-value < 0.05; data are Mean ± SEM
