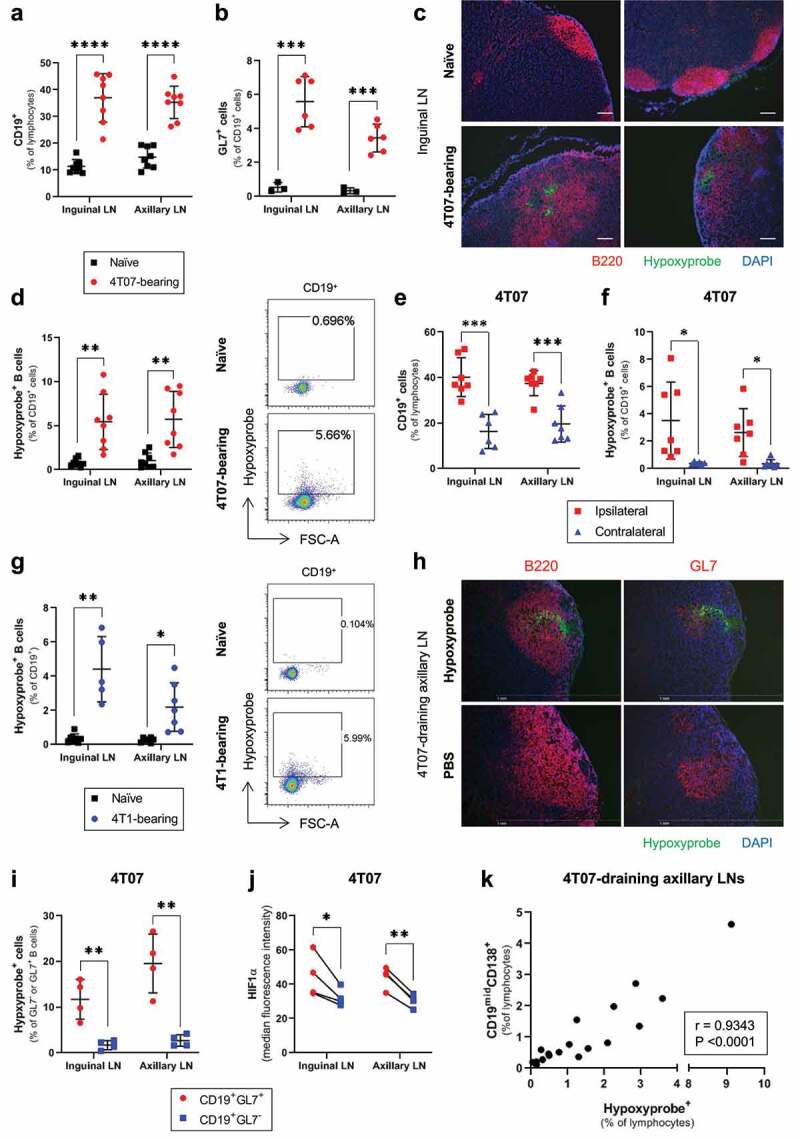
Figure 1.

Hypoxia develops in the GCs of LNs draining murine mammary tumors and associates with the levels of antibody-secreting cells
Flow cytometry data evaluating the frequency of (a) CD19+ B cells (% of lymphocytes; n = 8/group), and (b) GL7+ GC B cells (% of CD19+; n = 3–6/group), in the inguinal and axillary LNs of naïve and 4T07 tumor-bearing mice. (c) Immunofluorescence microscopy on sections of frozen inguinal LNs from naïve and 4T07-bearing mice stained for B cells (B220), the exogenous hypoxia marker pimonidazole (Hypoxyprobe), and nuclear counterstain (DAPI). Scale bar = 100 μm. (d) Frequency of Hypoxyprobe+ B cells (% of CD19+) in inguinal and axillary LNs from naïve and 4T07 tumor-bearing mice (n = 8/group). (e) Frequency of CD19+ B cells (% of lymphocytes) and (f) Hypoxyprobe+ B cells (% of CD19+) in ipsilateral and contralateral inguinal and axillary LNs from 4T07-bearing mice (n = 6–7/group). (g) Frequency of Hypoxyprobe+ B cells (% of CD19+) in inguinal and axillary LNs from naïve and 4T1 tumor-bearing mice (n = 5–8/group). (h) Immunofluorescence microscopy on sections of frozen axillary LNs from 4T07-bearing mice, injected with Hypoxyprobe or vehicle control (PBS), and stained for B cells (B220), GCs (GL7), hypoxia (Hypoxyprobe), and nuclear counterstain (DAPI). Scale bar = 1 mm. (i) Frequency of Hypoxyprobe+ cells in the GC (CD19+GL7+) and non-GC (CD19+GL7−) B cells of LNs draining 4T07 tumors (n = 4/group). (J) Median fluorescence intensity of HIF1ɑ among GC (CD19+GL7+) and non-GC (CD19+GL7−) B cells of LNs draining 4T07 tumors (n = 4/group). (k) Correlation plot between the frequency of Hypoxyprobe+ cells and ASCs in axillary LNs draining 4T07 tumors (n = 18 mice; mice were 21 weeks old). Two-tailed Student’s t-test (with Welch’s correction applied when groups had unequal variances) was used to assess statistical significance in (A), (B), (D), (E), (F) and (G), paired t-test was used in (I), and (J). Pearson correlation coefficient (r) is shown in (K). Data are mean ± SD.
