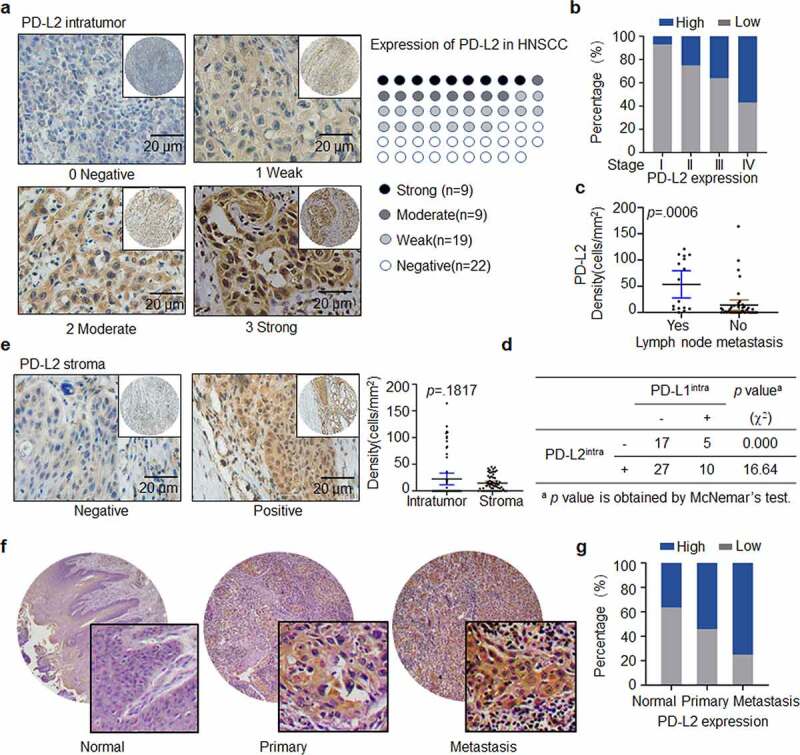
Figure 1.

Expression and distribution of PD-L2 in HNSCC specimens. (a) Representative immunohistochemistry (IHC) staining of PD-L2 in human HNSCC tumors. PD-L2 staining is negative if value is 0, weak if value is 1+, moderate if value is 2+, and strong if value is 3 + . Scale bar: 20 μm. (b) Comparing PD-L2 expression in different AJCC stages by Box plots. (c) Comparing PD-L2 expression in tumors with or without lymph node metastasis by Dot plots. (d) Correlation between the expression of intratumoural PD-L2 and PD-L1 using McNemar’s test. (e) Representative IHC staining of PD-L2 level in stromal cells. Comparison of PD-L2+ cells in intratumoural and stromal density using paired t tests. (f) Representative IHC staining of PD-L2 on a commercially purchased tissue microarray (HN803f, US Biomax) containing 61 primary and 8 metastatic HNSCC samples and 11 adjacent normal tongue specimens. (g) Differential expression of PD-L2 in normal tongue tissues, primary HNSCC specimens and metastatic HNSCC samples
