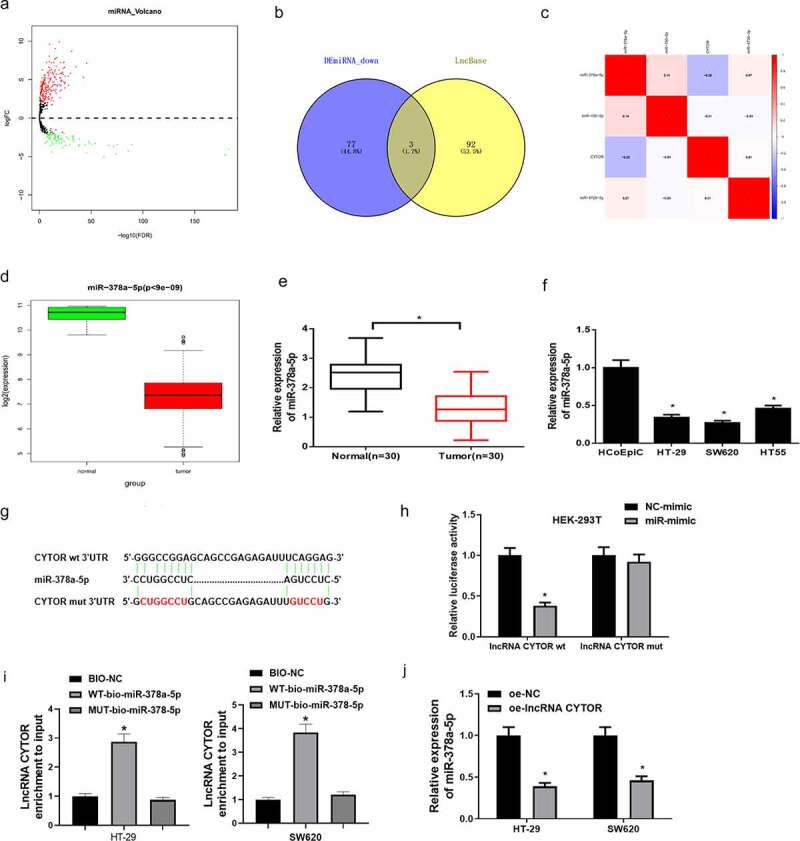
Figure 3.

LncRNA CYTOR modulates miR-378a-5p expression
(a) Volcano plot of differential miRNAs in colon carcinoma in TCGA dataset. Green refers to downregulated miRNAs and red refers to upregulated miRNAs. (B) Venn diagram of predicted target miRNAs and differentially down-regulated miRNAs. (c) Heatmap of Pearson correlation analysis of candidate target miRNAs and lncRNA CYTOR. (d) Boxplot of bioinformatics analysis of miR-378a-5p expression in normal group and tumor group in TCGA. Red refers to tumor group. Green refers to normal group. (e) qRT-PCR detected miR-378a-5p expression in normal tissue and tumor tissue (n = 30). (f) qRT-PCR detected miR-378a-5p expression in colon carcinoma cells. (g) Bioinformatics analysis predicted the binding sites between lncRNA CYTOR and miR-378a-5p. (h) LncRNA CYTOR-MUT has less inhibitory effect on miR-378a-5p than lncRNA CYTOR-WT. (i) RNA pull down exhibited that miR-378a-5p could bind lncRNA CYTOR. (j) MiR-378a-5p expression in HT-29 and SW620 cells after overexpressing lncRNA CYTOR. * denotes p < 0.05.
