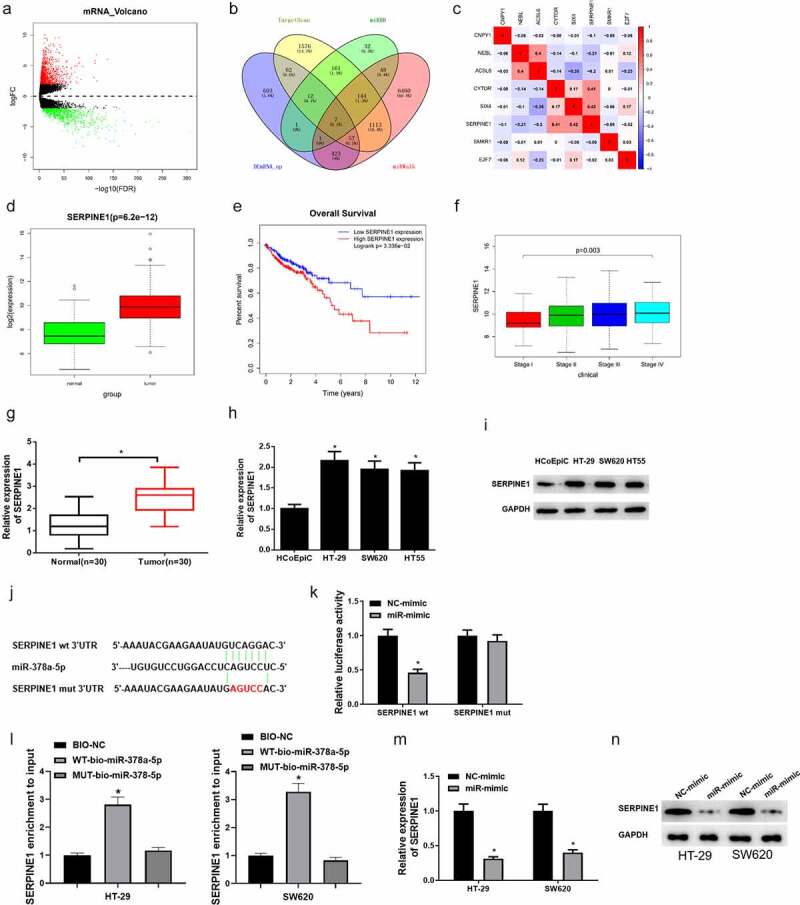
Figure 5.

MiR-378a-5p binds SERPINE1 in colon carcinoma cells
(a) Volcano plot of differential mRNAs in TCGA database. Green refers to differentially downregulated mRNAs. Red refers to differentially upregulated mRNAs. (b) Venn diagram of predicted target mRNAs of miR-378a-5p and the upregulated mRNAs. (c) Pearson correlation analysis between lncRNA CYTOR and predicted target mRNAs. (d) Boxplot of SERPINE1 expression in normal group and tumor group in TCGA dataset by bioinformatics analysis. Green refers to normal group. Red refers to tumor group. (e) Effect of SERPINE1 expression level on patient’s survival. Red refers to high SERPINE1 expression group. Blue refers to low SERPINE1 group. (f) Relationship between SERPINE1 and stages. (g) SERPINE1 mRNA expression in tumor tissue and normal tissue detected by qRT-PCR (n = 30). (h) SERPINE1 mRNA expression in normal cells and tumor cells detected by qRT-PCR. (i) SERPINE1 protein expression in normal cells and colon carcinoma cells detected by western blot. (j) The binding sites of miR-378a-5p and target gene SERPINE1 predicted by bioinformatics analysis. (k) Dual-luciferase reporter gene assay testified the target relationship between miR-378a-5p and SERPINE1. (l) RNA pull down detected the binding between miR-378a-5p and SERPINE1. (m) qRT-PCR assay illustrated that overexpressed miR-378a-5p suppressed SERPINE1 mRNA expression. (n) Western blot detected effect of miR-378a-5p overexpression on SERPINE1 protein expression in cells. * denotes p < 0.05.
