
Fig. 3: IL12-GEMy treatment reverses the core immune suppression gene program in the lung microenvironment and activates adaptive immunity.
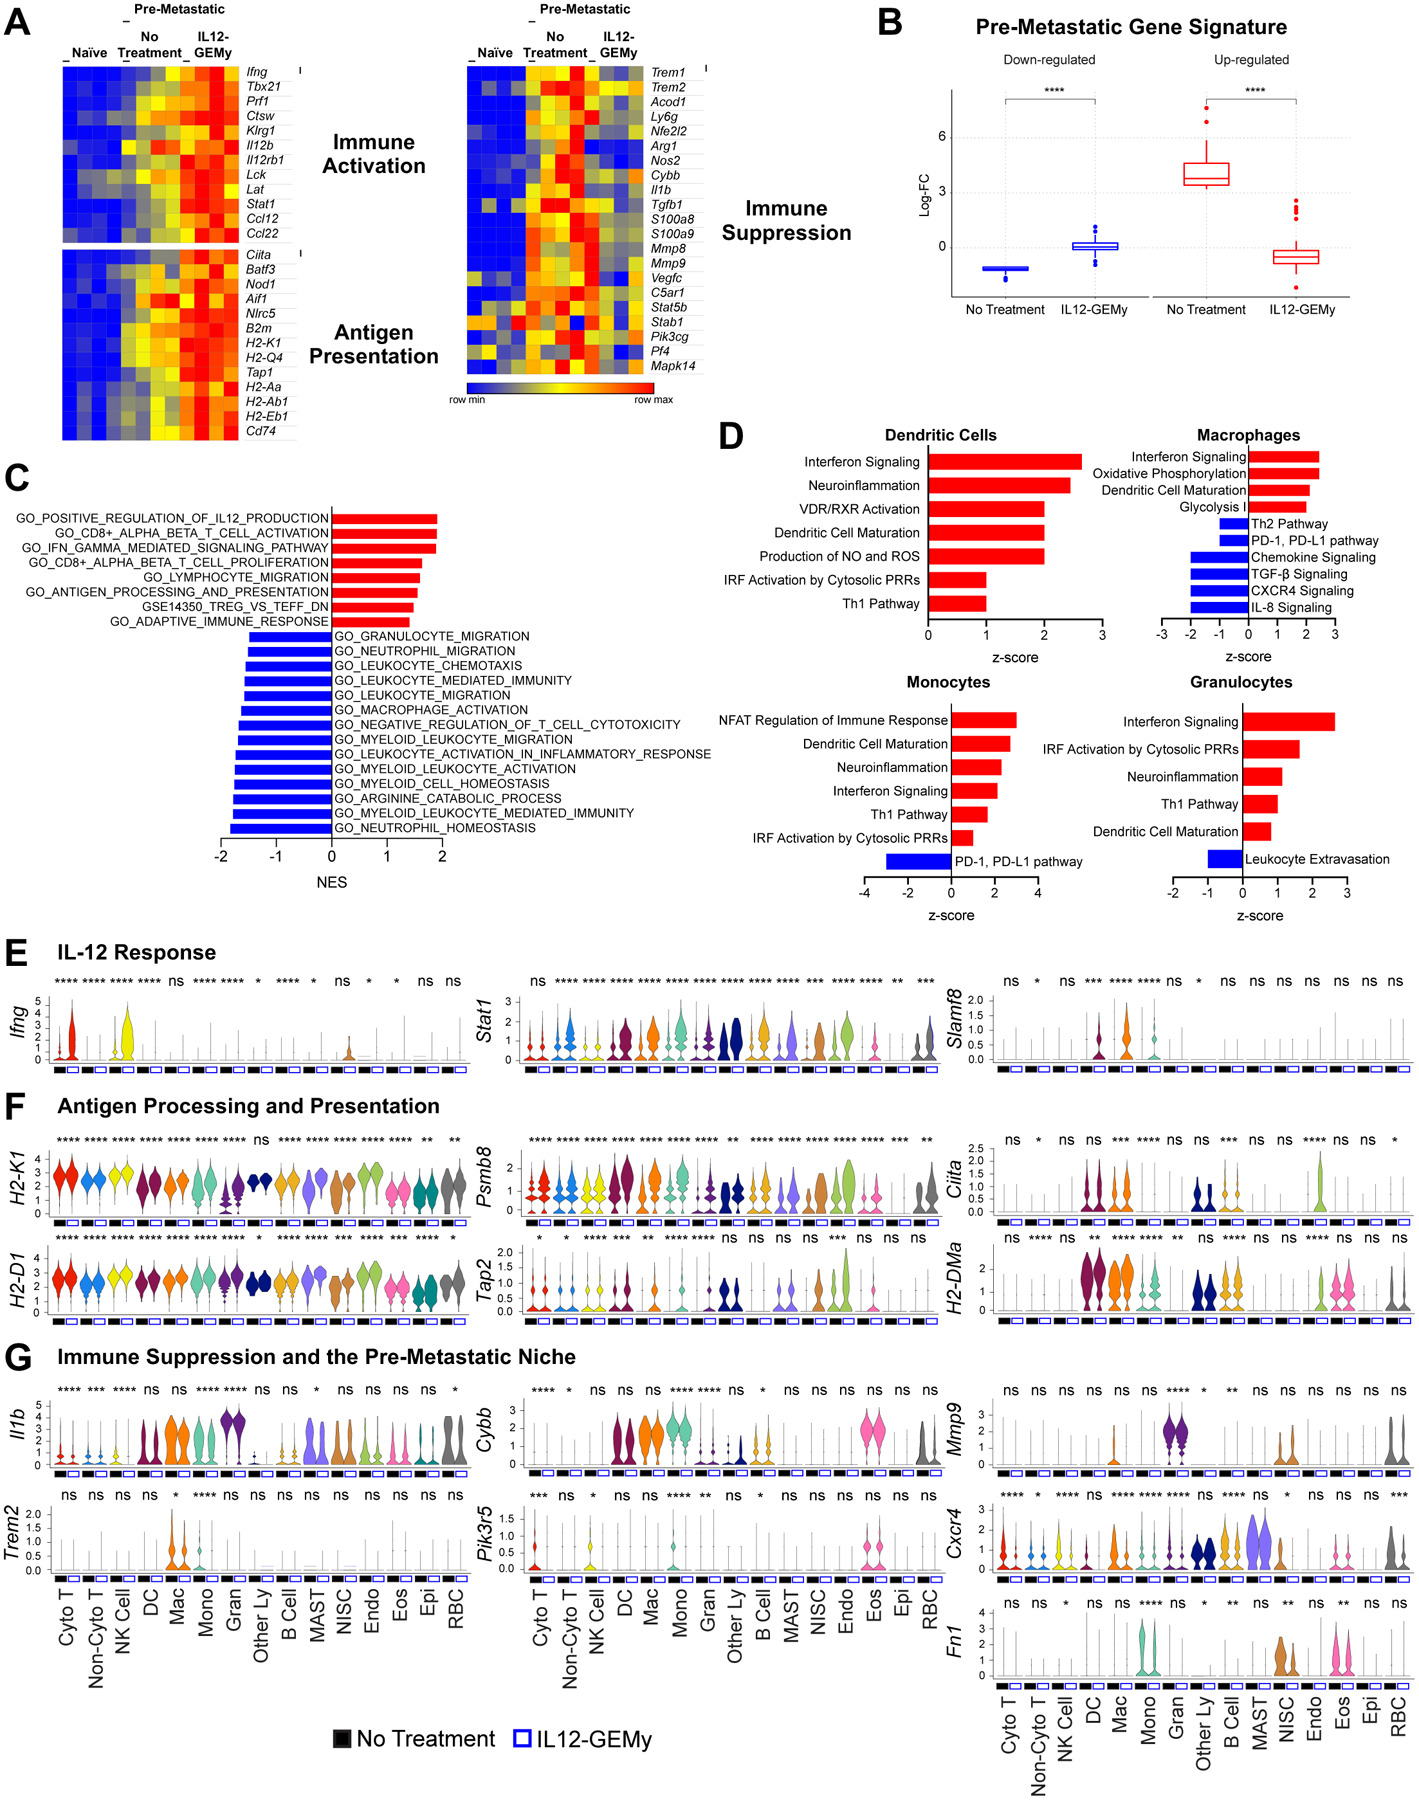
Mice were inoculated with M3-9-M ffluc-mCherry primary tumor and treated with 8×10⁶ IL12-GEMys on day 12. Lungs were flash frozen (A-C) or processed into single cell suspension (D-G) three days post-treatment (n=4 mice per group). A) Expression of selected genes in the lung comparing naïve non-treated tumor-bearing mice and IL12-GEMy-treated tumor-bearing mice. B) Log-fold changes of the top 50 genes up-regulated in pre-metastatic lungs (red) and the top 50 genes down-regulated in pre-metastatic lungs (blue) in the lungs of non-treated and IL12-GEMy-treated tumor-bearing mice. P-values were determined using a one-sided Wilcoxon rank-sum test. C) Gene set enrichment analysis of differential gene expression data from the lungs of IL12-GEMy-treated compared to non-treated mice. Red bars indicate a positive normalized enrichment score (NES) and blue bars indicate a negative normalized enrichment score (NES). D) Ingenuity pathway analysis of the differential gene expression between IL12-GEMy-treated and non-treated pre-metastatic lungs for individual myeloid cell clusters by single cell RNA sequencing. Red bars indicate positive z-scores and blue bars indicate negative z-scores. E-G) Expression levels of key genes associated with E) response to IL-12, F) antigen processing and presentation, and G) immune suppression and the pre-metastatic niche are shown on a per-cluster basis for non-treated and IL12-GEMy-treated tumor-bearing mice. Cyto T = cytotoxic T cells; Non-Cyto T = non-cytotoxic T cells; NK Cells = natural killer cells; DC = dendritic cells; Mac = macrophages; Mono = monocytes; Gran = granulocytes; Other Ly = other lymphocytes; MAST = MAST cells; NISC = non-immune stromal cells; Endo = endothelial cells; Eos = eosinophils; Epi = epithelial cells; RBC = erythrocytes. Statistical differences between groups analyzed by Wilcoxon test. **** p < 0.0001; *** 0.0001 < p < 0.001; ** 0.001 < p < 0.01; * 0.01 < p < 0.05. See also Figure S6A–D.