
Fig. 4: IL12-GEMy treatment limits metastasis and extends survival in mice.
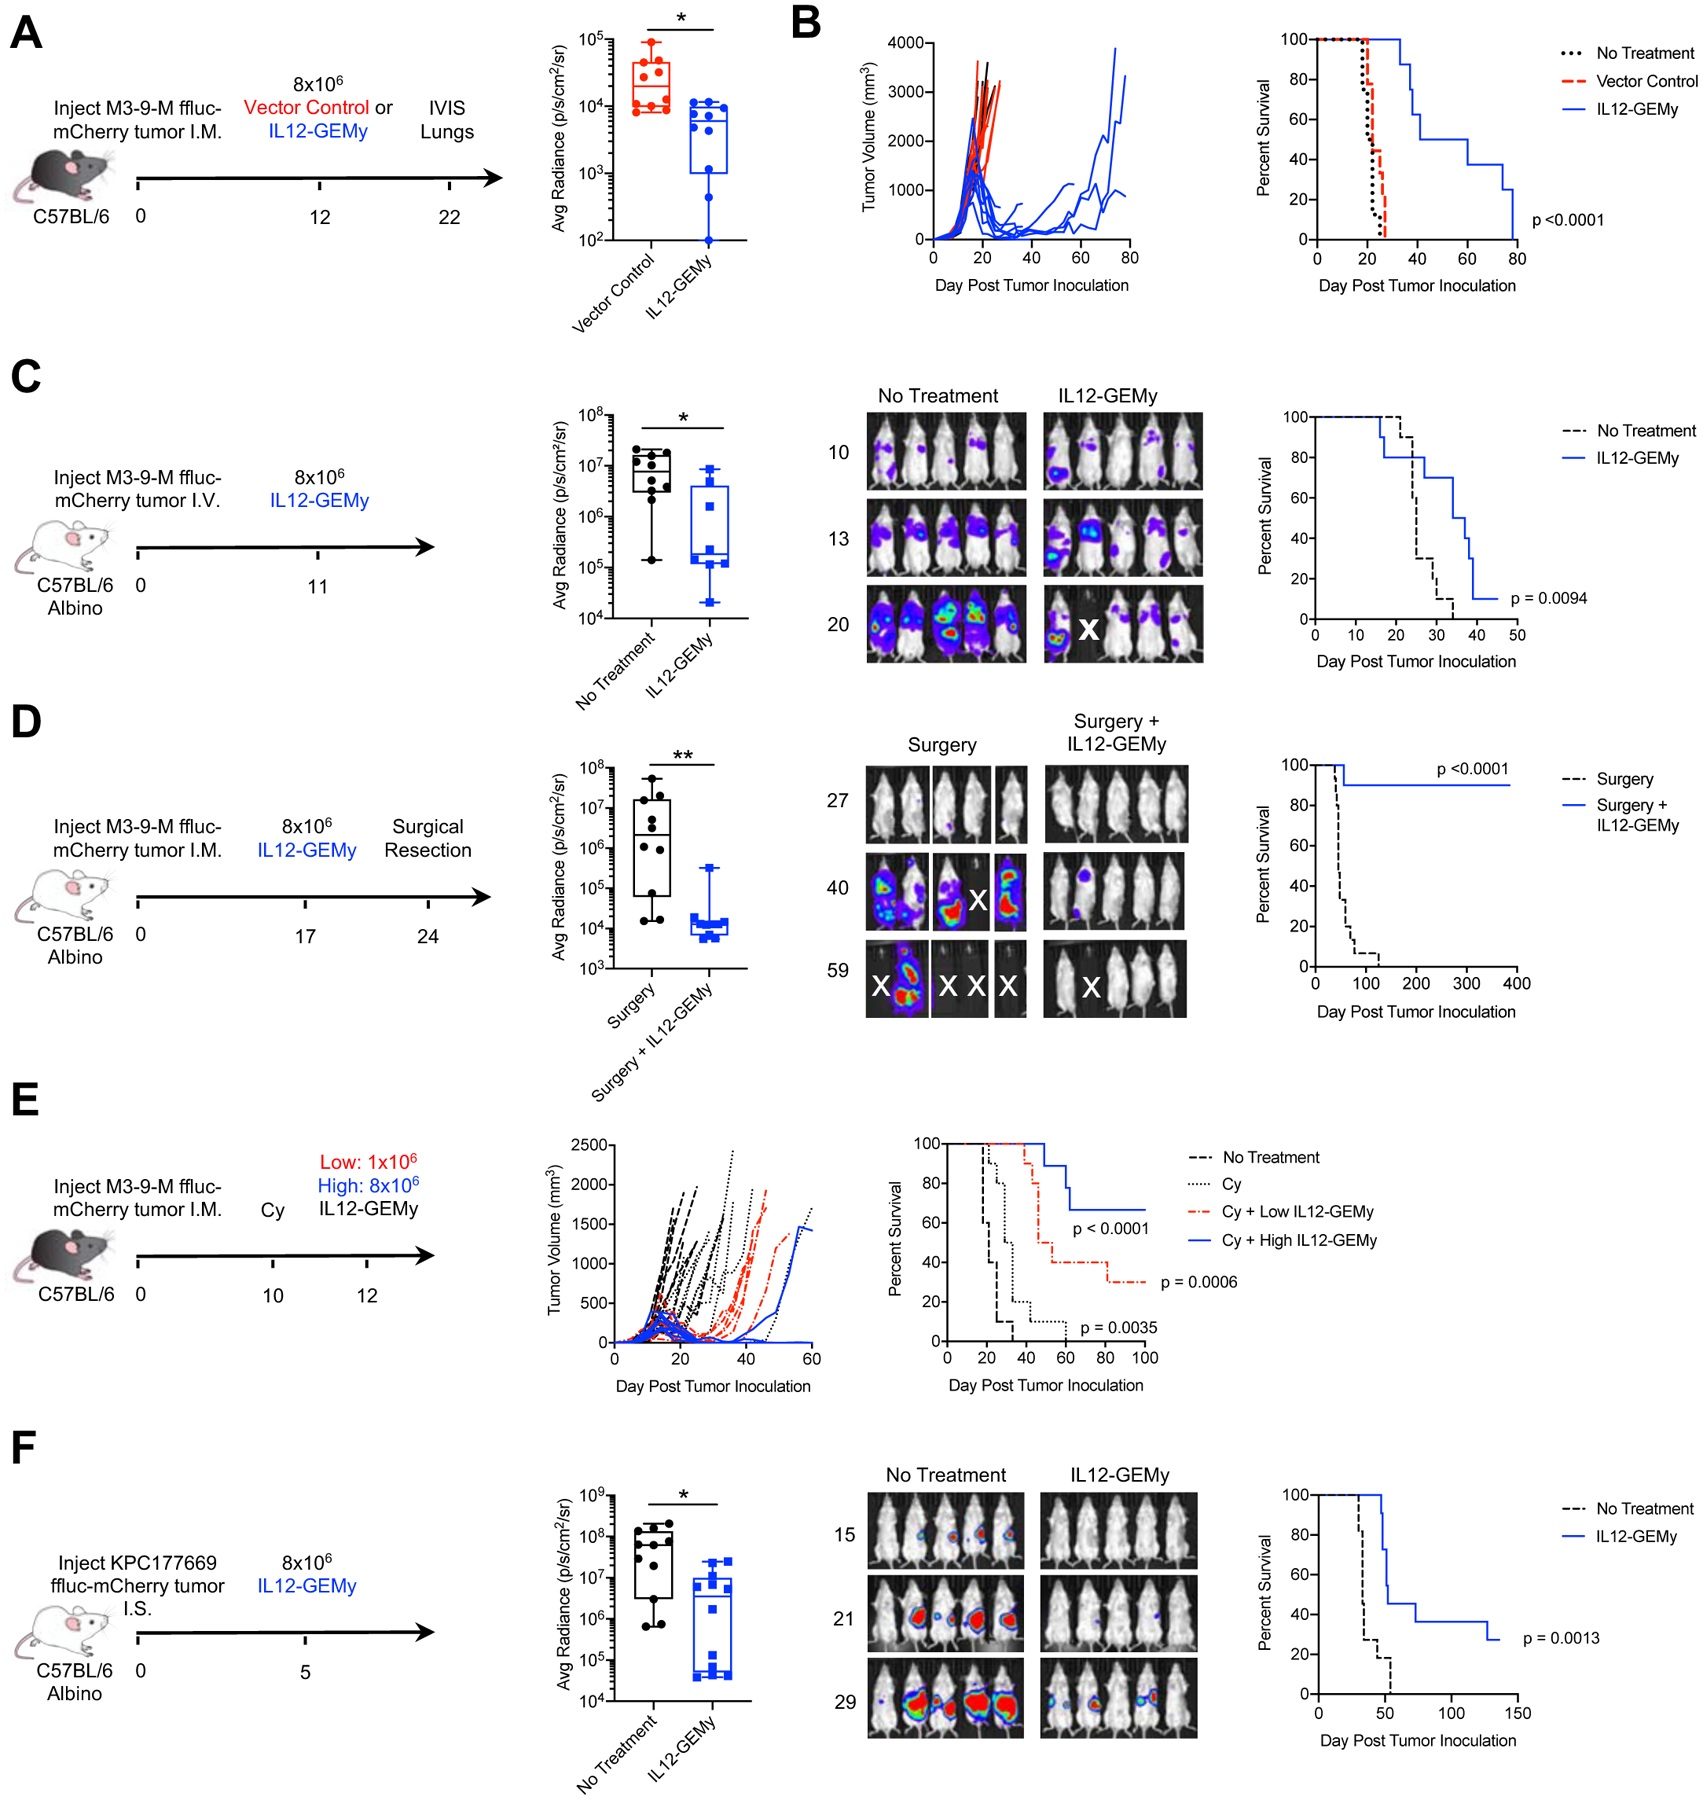
A-B) Mice were injected orthotopically with 5×10⁵ M3-9-M ffluc-mCherry tumor cells and treated with 8×10⁶ vector control or IL12-GEMys on day 12. A) Lungs were harvested on day 22 and bioluminescent metastatic burden in the lungs was measured using an in vivo imaging system (IVIS) (n=10 mice per group) and analyzed by Kolmogorov-Smirnov test. B) Mice were monitored for tumor growth and survival (n=10 mice per group) analyzed by Log-rank (Mantel-Cox) test. C) Mice were injected with 5×10⁴ M3-9-M ffluc-mCherry via tail vein and treated with 8×10⁶ IL12-GEMy i.v. 11 days post tumor injection, then followed for survival and metastatic progression by bioluminescent imaging using IVIS (no treatment n=10, IL12-GEMy n=8). Quantification is shown on day 20 post tumor inoculation and analyzed by Kolmogorov-Smirnov test. Representative IVIS images and average radiance of tumor-bearing mice are shown. Survival curves were analyzed by Log-rank (Mantel-Cox) test. D) Mice were orthotopically injected with 5×10⁵ M3-9-M ffluc-mCherry cells and treated with 8×10⁶ IL12-GEMys on day 17 followed by primary tumor resection by amputation of the tumor-bearing leg on day 24 and monitored for metastatic progression and survival by IVIS (no treatment n=15, IL12-GEMy n=10). Average radiance of mice on day 40 post tumor injection analyzed by Kolmogorov-Smirnov test and representative IVIS images are shown. E) Mice were orthotopically inoculated with 5×10⁵ M3-9-M ffluc-mCherry cells. On day 10, groups of mice were left untreated or given a single dose of 2 mg cyclophosphamide (Cy) i.p. On day 12, groups of mice were left untreated or treated with 1×10⁶ or 8×10⁶ IL12-GEMys i.v. (labeled “Low IL12-GEMy” and “High IL12-GEMy,” respectively) and followed for primary tumor growth and survival (n=10). Statistics measured by Log-rank (Mantel-Cox) test. are shown for Cy compared to no treatment (p=0.0035), Cy + Low IL12-GEMy compared to Cy (p=0.006), and Cy + High IL12-GEMy compared to Cy (p<0.001). F) Mice were injected intrasplenically with 5×10⁵ KPC177669-ffluc2-mCherry cells, spleens were resected, and mice were treated with 8×10⁶ IL12-GEMys on day 5. Mice were monitored for survival and tumor growth by IVIS. average radiance of tumor-bearing mice on day 29 analyzed by Kolmogorov-Smirnov test and representative IVIS images and are shown (no treatment n=11, IL12-GEMy n=12). Survival data were tested for significance by Log-rank (Mantel-Cox) test. **** p < 0.0001; *** 0.0001 < p < 0.001; ** 0.001 < p < 0.01; * 0.01 < p < 0.05. In boxplots, the center line represents the median, the box limits denote the 25th to the 75th percentile and the whiskers represent the minimum and maximum value. See also Figure S6E–G.