
Fig. 5: IL12-GEMy treatment induces T and NK cell activation.
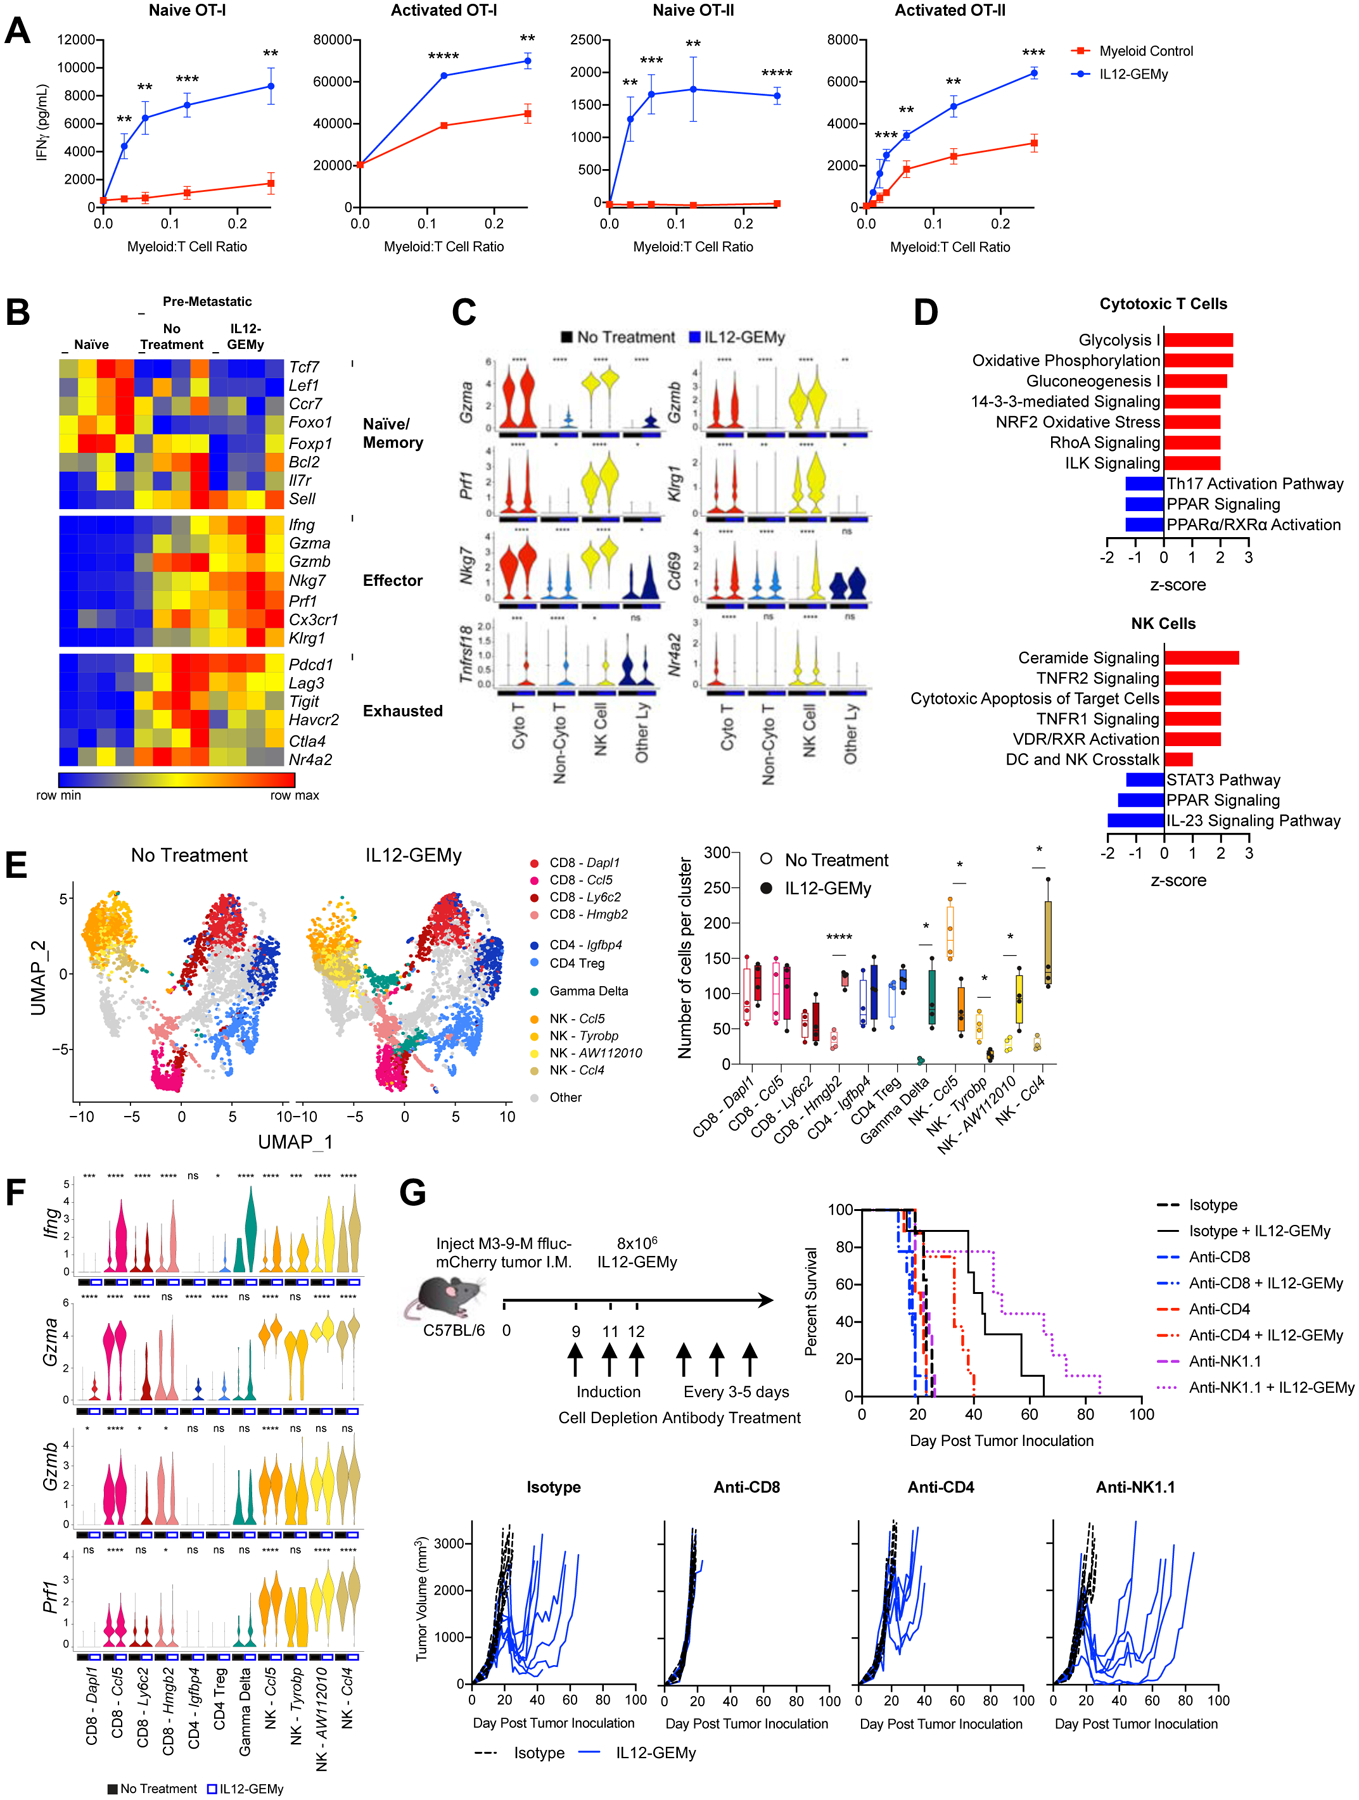
A) Naïve or activated splenocytes from OT-I or OT-II mice were co-cultured with non-transduced control myeloid cells or IL12-GEMys at various ratios and IFNγ was quantified by ELISA at 24 hours. Statistical analysis was performed by unpaired t test at each ratio. B) The expression of key T cell phenotype genes in bulk RNA isolated from the lungs of naïve, tumor-bearing mice, or 8×10⁶ IL12-GEMy treated tumor-bearing mice on day 15 post primary tumor inoculation and 3 days after IL12-GEMy treatment (n=4). C) Violin plots of scRNA-seq data showing gene expression by cluster (n=4). Statistical differences between groups analyzed by Wilcoxon test. Cyto T = cytotoxic T cells; Non-Cyto T = non-cytotoxic T cells; NK Cells = natural killer cells; Other Ly = other lymphocytes. D) Ingenuity pathway analysis of cytotoxic T cell and NK cell clusters from single cell RNA sequencing. Red bars indicate positive z-scores and blue bars indicate negative z-scores. E) Cytotoxic T cell, Non-Cytotoxic T cell, NK cell, and Other Lymphocyte clusters were subsetted from the whole lung scRNA-seq analysis and reclustered to identify more specific cell subsets. UMAP plots and the number of cells per cluster is shown. Statistical analysis between groups was performed by Kolmogorov-Smirnov test of each cluster. F) The expression level of genes associated with effector function and cytotoxicity in the high resolution T and NK cell clusters. Statistical differences between groups analyzed by Wilcoxon test. G) M3-9-M ffluc-mCherry tumor-bearing mice were treated with 200 ug of isotype, anti-CD8, or anti-CD4 antibody or 100 ug of anti-NK1.1 antibody i.p. on days 9, 11, and 12 to induce depletion of cell populations. 8×10⁶ IL12-GEMys were injected intravenously on day 12. Depletion antibody treatment was continued at 200 ug per dose every 3–5 days for the duration of the experiment. Survival and tumor growth of mice treated with IL12-GEMys and antibody depletion regimens are shown (n=9). Survival data were tested for significance by Log-rank (Mantel-Cox) test. **** p < 0.0001; *** 0.0001 < p < 0.001; ** 0.001 < p < 0.01; * 0.01 < p < 0.05. In line graphs, data are represented as mean ± SEM. In boxplots, the center line represents the median, the box limits denote the 25th to the 75th percentile and the whiskers represent the minimum and maximum value. See also Figure S6H and Figure S7A.