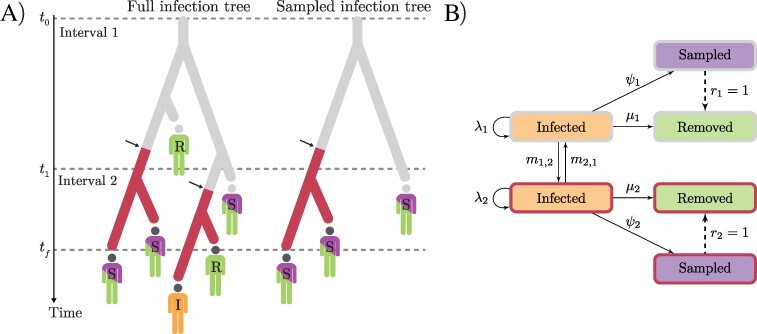
Figure 1.

Depiction of the MTBD model. (A) A full infection tree and a sampled infection tree (T), with two time intervals (epochs) and two demes (indicated in grey and red). All lineages in the trees represent infected individuals (I). Branching corresponds to transmission and colour change (arrows) corresponds to migration; infected individuals may be removed (R) or sampled and then removed (S). (B) Transition diagram: solid and dashed arrows labelled with rates and probabilities, respectively.
