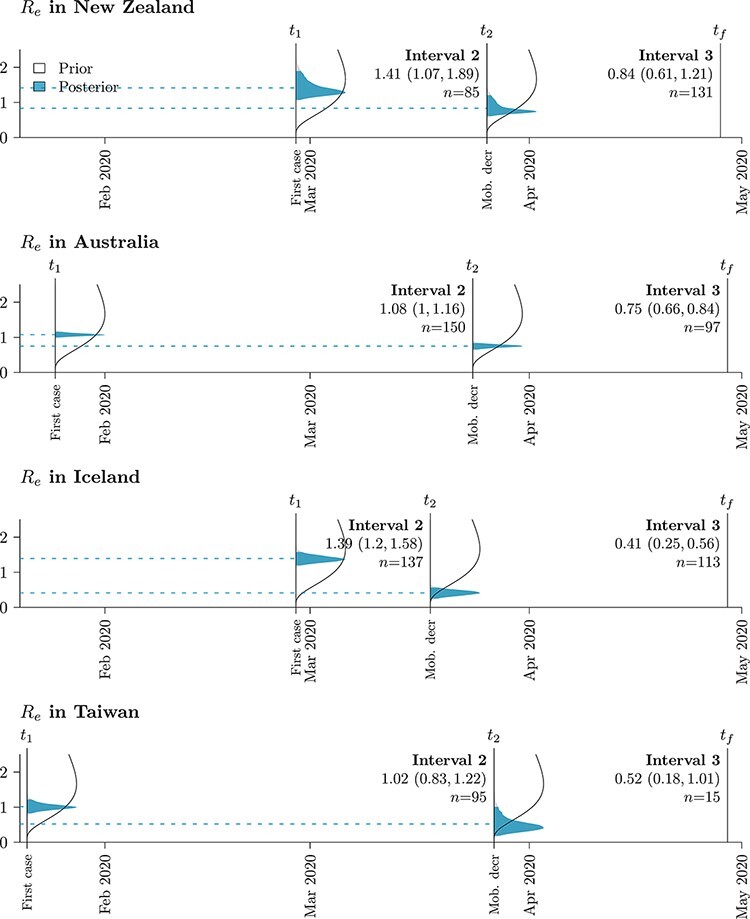
Figure 3.

Re prior (white) and posterior (blue) probability distributions across islands and time intervals (n samples in each interval). Posterior means are indicated by dashed lines. Mean estimates (and 95 per cent highest posterior density intervals) are indicated under each time interval: t1 is the first case in the target deme, t2 the start of mobility reduction, and tf the final sample in the data set.
