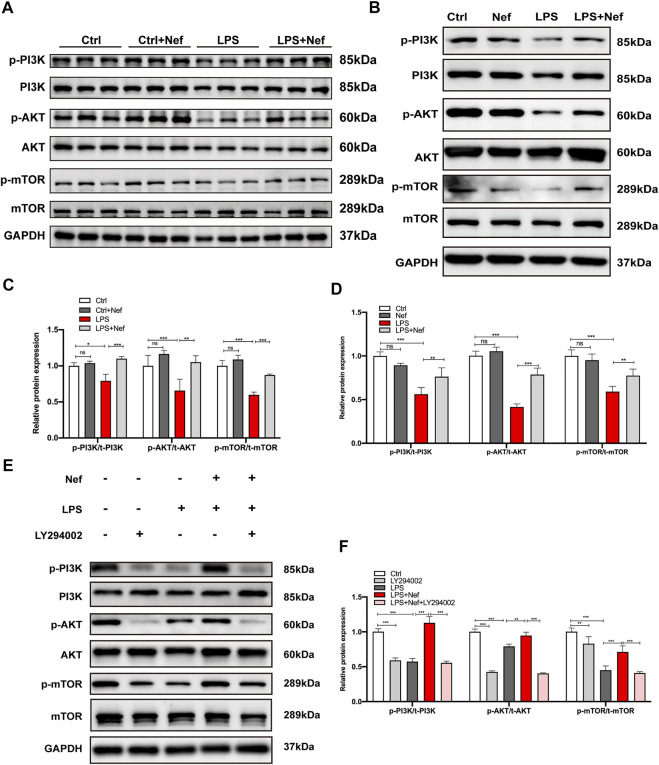
FIGURE 6.
Neferine reversed the LPS-induced downregulation of the PI3K/AKT/mTOR signaling pathway in vivo and in vitro (A) Representative Western blot images of p-PI3K, PI3K, p-AKT, AKT, p-mTOR, and mTOR in mice (B–E) Representative Western blot images of p-PI3K, PI3K, p-AKT, AKT, p-mTOR, and mTOR in H9c2 cells (C) Densitometric quantification analysis of the protein expression levels of p-PI3K, PI3K, p-AKT, AKT, p-mTOR, and mTOR in mice (D–F) Densitometric quantification analysis of the protein expression levels of p-PI3K, PI3K, p-AKT, AKT, p-mTOR, and mTOR in H9c2 cells. All data are expressed as mean ± standard deviation. All experiments were repeated at least three times. *p < 0.05, **p < 0.01, ***p < 0.001; ns: no significant difference.

