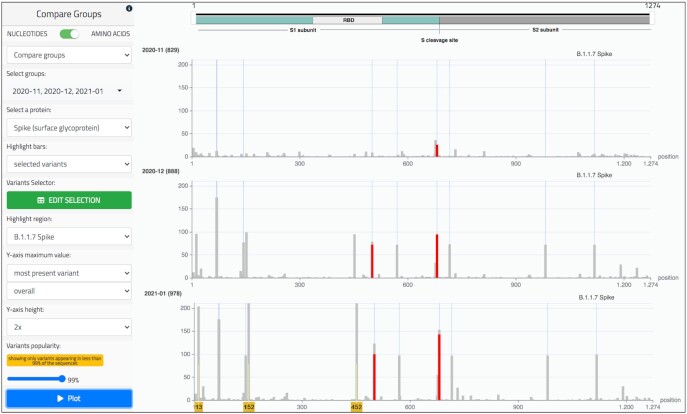
Figure 6.
Group comparison page of the running example. The tracks represent sequences of the three groups filtered by date (November 2020, December 2020, and January 2021), as illustrated in Figure 2. The amino acid mode is selected and the Spike protein is observed. In the ‘Highlight region’ menu we select the variants that belong to the B.1.1.7 lineage (or ‘UK strain’), as defined in https://virological.org/t/preliminary-genomic-characterisation-of-an-emergent-sars-cov-2-lineage-in-the-uk-defined-by-a-novel-set-of-spike-mutations/563: HV 69-70 deletion, Y144 deletion, N501Y, A570D, P681H, T716I, S982A, D1118H; we note that all these bars become higher with the progression of time. Variants that are present in more than 99% of sequences are filtered to remove the confusing effect of frequent variants, such as D614G, now present in the great majority of sequences; then, the Y-axis maximum value is set to the height of the most present variant over all the tracks (i.e. 211 units in the third track). We further highlight in red two variants of particular concern: (i) the Asparagine (N) mutating into Tyrosine (Y) at position 501, possibly decreasing the neutralizing activity of convalescent plasma (22); (ii) the Proline (P) mutating into Histidine (H) at position 681, directly adjacent to the S1/S2 furin cleavage site, shown to promote the viral entry into lung cells (23). Note that the red portions only cover part of the bars, as the rest of them represent changes into different amino acids. In addition to the B.1.1.7 variants, we can observe additional variants whose presence is increasing: see positions 13, 152, 452 (marked with yellow number tags at the bottom). These amino acid changes identify the so-called ‘Californian variant’, which was still under definition in January 2021, the last period of observation (24). The figure is built by choosing the option ‘most present variant/overall’ and by expanding the Y-axis by a 2× coefficient.

