
Figure 7.
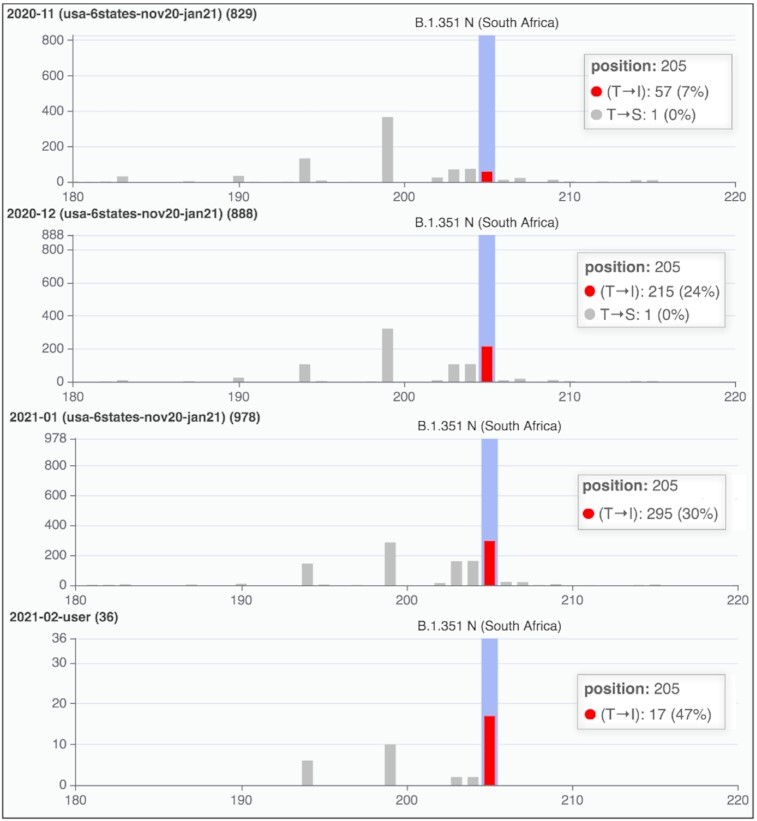
Comparison of three groups from the running example and an additional group derived from user-input batch of sequences, submitted to GenBank in February 2021. We observe the T205I change in the N protein; comparatively, bars show an increase of the percentage of the sequences carrying the variant. The figure has been built by zooming 1.5x the default Y-axis options and selecting the X-axis range 180–220 of the N protein.