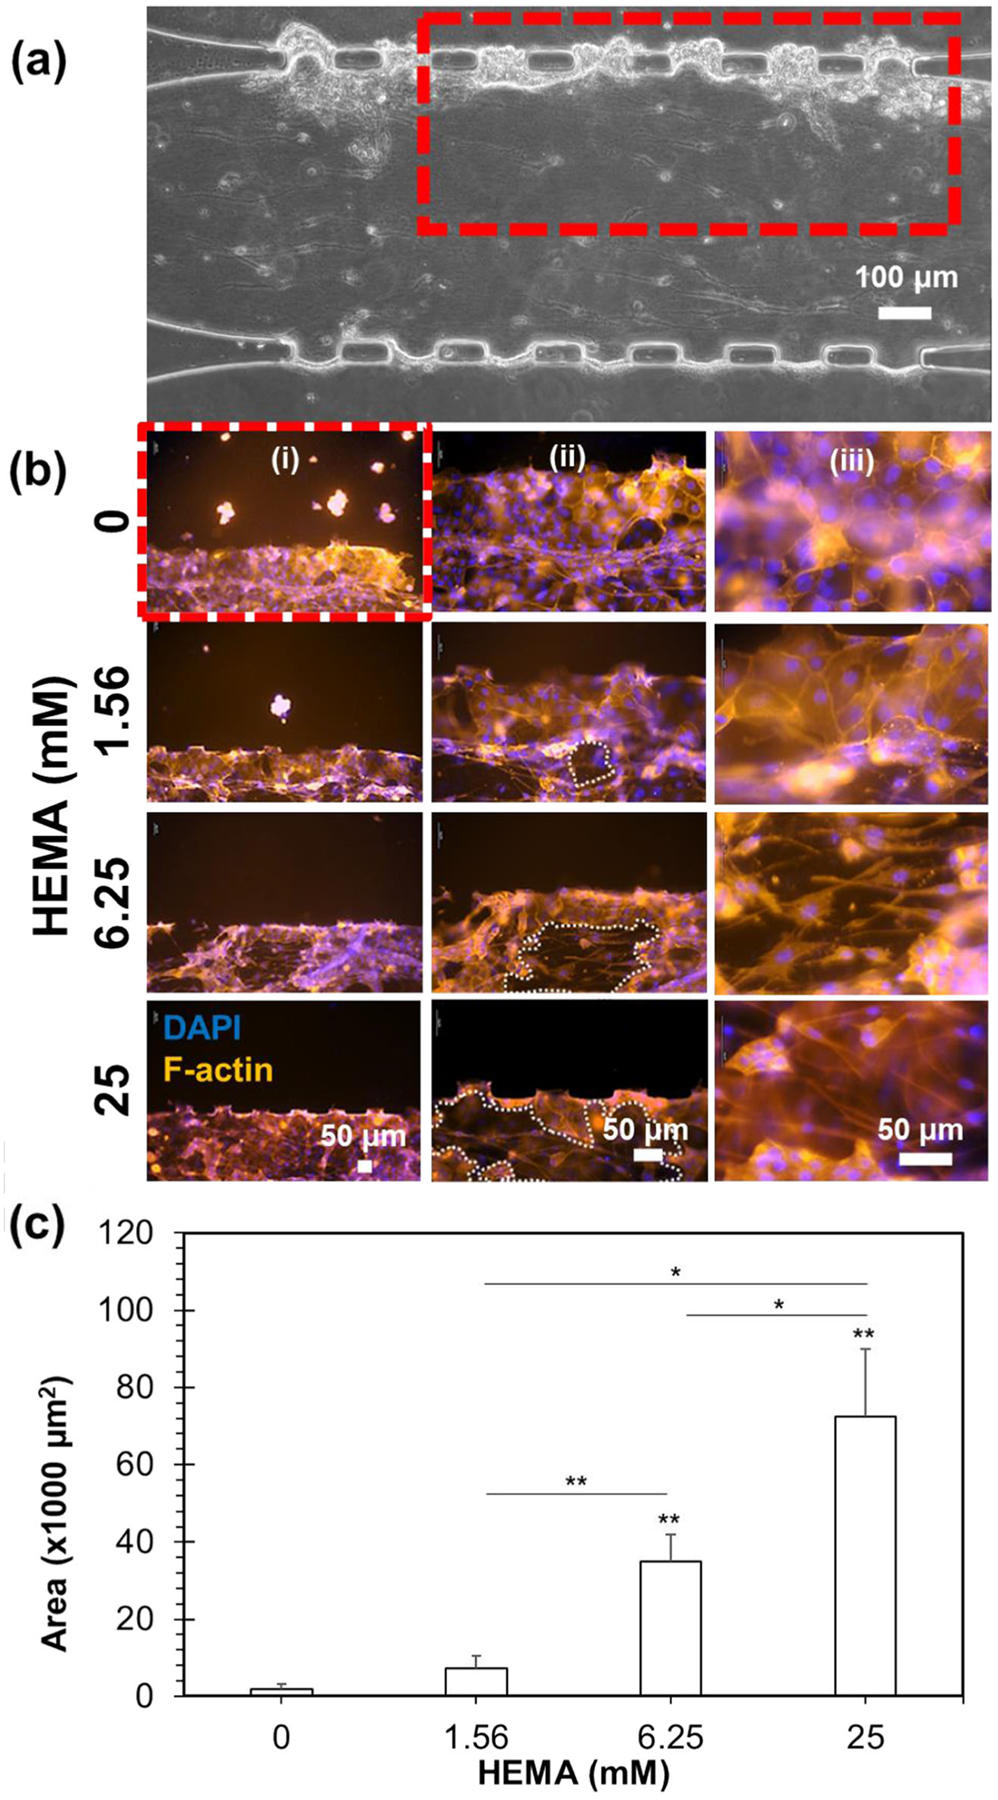
Fig. 3.

Epifluorescence micrographs of mucosa-chip chamber post-HEMA exposure. (a) The mucosal construct under phase contrast microscopy. The red rectangle indicates the zoom-in image in B(i). (b) The mucosal construct treated with different HEMA concentration under epifluorescence microscopy, in which the cells were fixed and stained with phalloidin (red) and DAPI (blue) to reveal the epithelial and sub-epithelial layers. The images were taken at different magnification with scale bars as indicated. The white-dashed regions in (ii) indicate the voids emerged post-HEMA exposure. (c) The area of voids within mucosa-chips post-exposure to different HEMA concentration. Data = mean ± SD, (*) indicates p < 0.05 and (**) indicates p < 0.01
