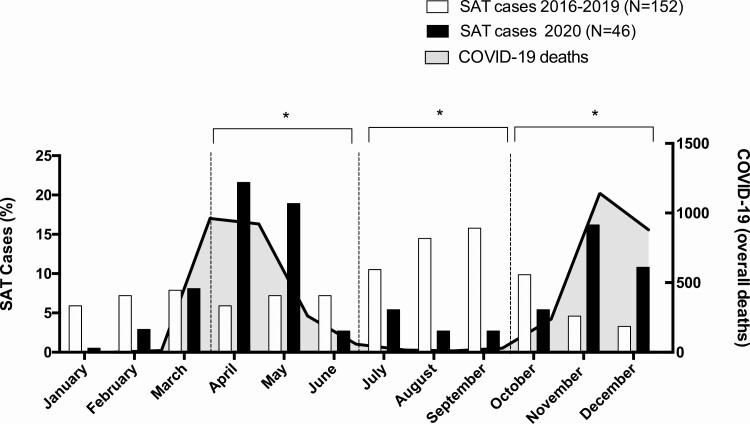
Figure 1.
Percentage distribution of cases of SAT in years 2016-2019 (white columns) and in 2020 (black columns). The absolute number of cases of deaths for SARS-COV-2 in 2020 in Tuscany is reported as solid gray curve. The dashed vertical line identifies each quarter. Data on deaths related to SARS-CoV-2 infection were obtained from the public records of the “Istituto Superiore di Sanità, Rome, Italy” (https://www.iss.it/coronavirus, access on February 2, 2021) *P <.05 between the 2 groups in the quarter.

