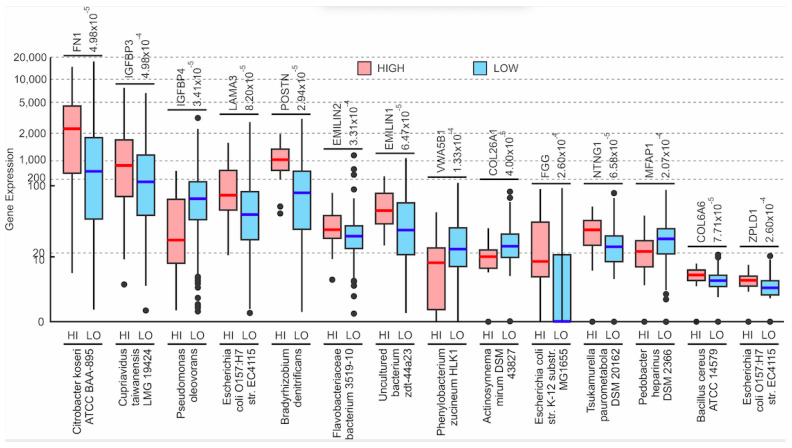
Figure 2.
Microbe association with the ECM protein coding genes. Boxplots of specific ECM protein coding gene expression vs. microbial abundance (Kruskal–Wallis test, p < 0.05). Dots in the boxplots represent outliers. The cut-off value between high and low microbe abundance for each microbe is listed above the plot for each microbe, beside the name of the gene that the specific microbe is being correlated to. Although these cut-off values were determined from the mean abundance of each microbe across all samples, the values essentially discerned between the presence and the absence of a microbe within a sample.

