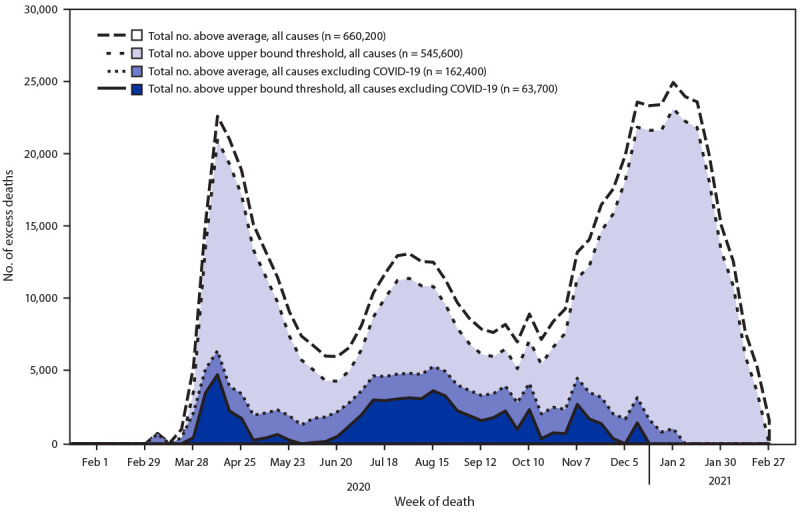
FIGURE.

Weekly and total numbers of excess deaths from all causes, and from all causes other than COVID-19* above the average number expected and the upper bound of the 95% prediction interval† — United States, January 26, 2020–February 27, 2021
* Weekly numbers of deaths from all causes and from all causes other than COVID-19 were obtained from the National Vital Statistics System.
† The average expected number and the upper bound of the 95% prediction interval (the range of values likely to contain the value of a single new observation) were estimated using overdispersed Poisson regression models of 2013 mortality data to the most recent week, with spline terms to account for seasonal patterns. The numbers of excess deaths correspond to the observed numbers of deaths above each threshold. Total numbers of excess deaths were summed from January 26, 2020, through February 27, 2021.
