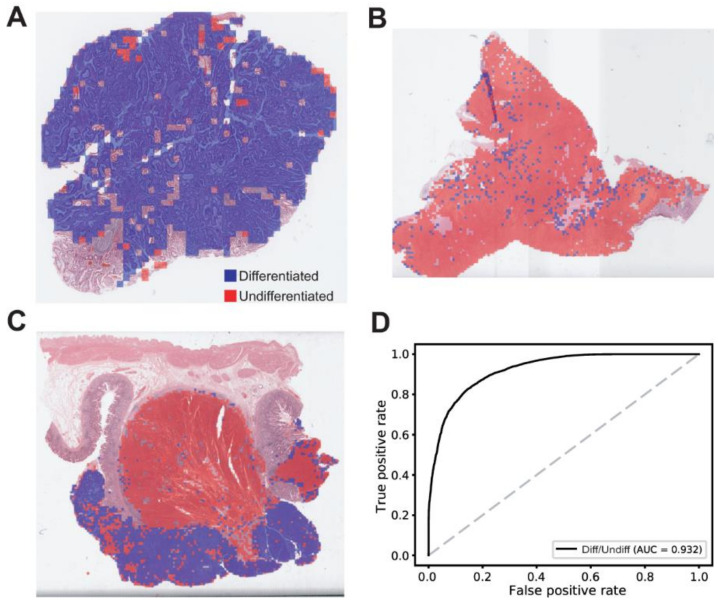
Figure 2.
Results for the differentiated/undifferentiated classification on the TCGA-STAD dataset. (A) A representative heatmap overlaid on a tissue slide image demonstrating a mainly differentiated tumor tissue. (B) A representative heatmap overlaid on a tissue slide image demonstrating a mainly undifferentiated tumor tissue. (C) A representative heatmap overlaid on a tissue slide image demonstrating a mixed tumor tissue. (D) The patch-level area under the curve (AUC) for the receiver operating characteristic curve of the differentiated/undifferentiated classifier.

