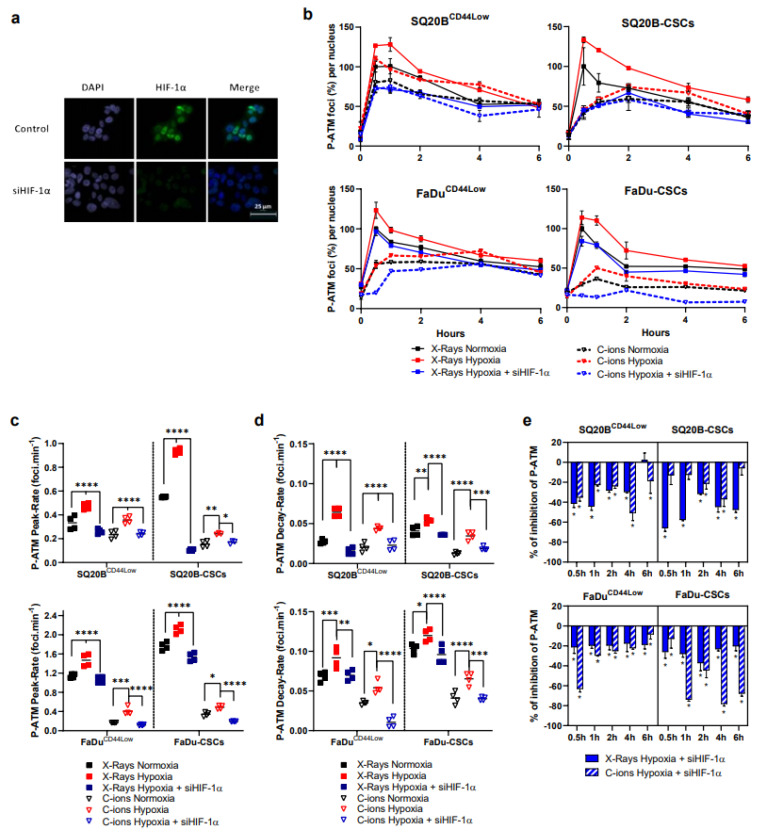
Figure 2.
The silencing of HIF-1α combined with photons and C-ions decreases the initiation of the signaling of DSBs under hypoxia. (a) Representative images of silencing of HIF-1α in SQ20BCD44Low cells under hypoxia at 4 h. (b) Kinetics of ATM phosphorylation (P-ATM) after 2 Gy X-rays or C-ions, ± siHIF-1α. The percentages of foci per nucleus were calculated for each condition considering the X-ray normoxic peak as the reference. The symbols and error bars indicate means ± SD values. (c,d) represent respectively the P-ATM peak-rate from basal levels to peak and its decay-rate from peak to 6 h, as determined from the data shown in (b). Each plot represents the mean ± SD values (two-way ANOVA test, * p < 0.05, ** p < 0.01, *** p < 0.001, **** p < 0.0001). (e) Effect of HIF-1α silencing on p-ATM expression under hypoxia. The p-ATM percentages between hypoxic conditions were statistically compared (Student’s t-Tests, Holm–Sidak method, α = 0.5) (n = 3 photons; n = 2 C-ions).

