Figure 6.
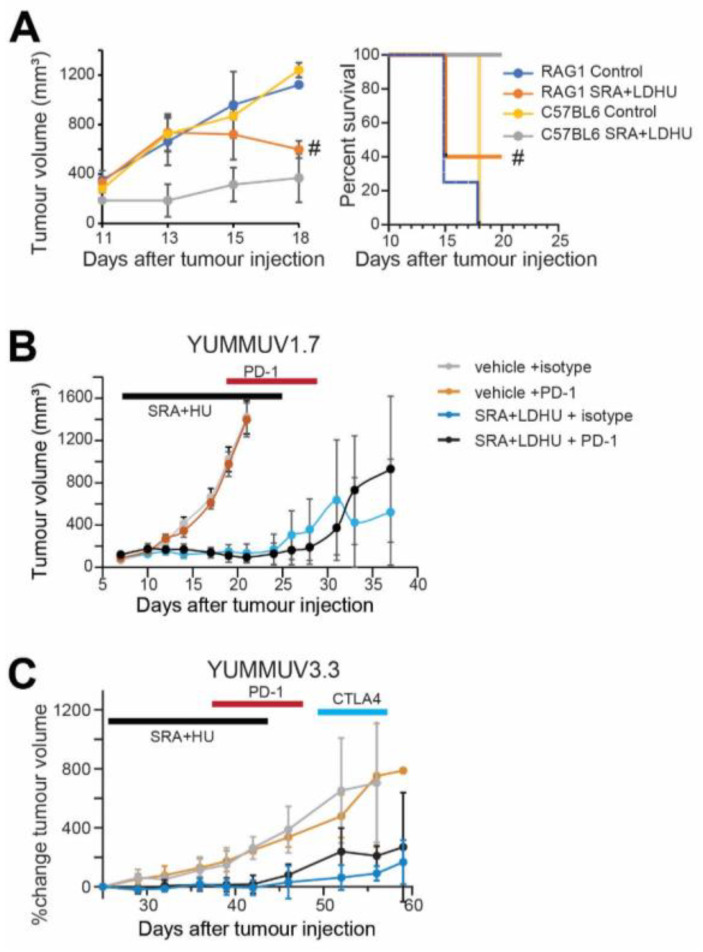
Tumour growth curves for CHK1i+LDHU ± immune checkpoint inhibitor-treated tumour-bearing mice. (A) YUMMUV1.7 tumours were established in Rag1−/− (five mice/group) and immune-competent C57BL/6J (three mice/group) mice then treated from day 11 with SRA737+LDHU as previously. Tumour size was monitored. # indicates tumour size of the two remaining mice after three had reached ethical size limits (>1 cm3). Kaplan–Meier curve of the same experiment. (B) YUMMUV1.7 tumour bearing mice either without or with CHK1i+LDHU treatment, then treated with either isotype IgG or anti-PD-1. The data are for groups of 4–5 mice. The periods of treatment are indicated. (C) Similar data for YUMMUV3.3 mice expressed as percentage change from immediate pre-treatment volume. The individual mouse tumour growth is shown in Figure S10.

